$GRASS/USDT Trading IdeaGRASS/USDT is building bullish momentum on the charts. There’s a high probability that, with this uptrend, it could reach and retest $3.5 again. Keep an eye on this setup.
GRASSUSDT trade ideas

Long Entry Signal for GRASS/USDT Based on the daily chart for GRASSUSDT on Bybit, here's a concise analysis:
MLR vs. SMA: The MLR (blue) is above the SMA (pink), indicating a bullish trend.
MLR vs. BB Center: The MLR is above the BB Center Line (orange), suggesting bullish momentum.
PSAR: The PSAR dots (black) are under the price, confirming a bullish trend.
Exception: There is no 200-period SMA available to guide us on the long-term trend, so proceed with caution.
Current Strategy: Since all entry conditions for a long position are met (MLR above SMA, MLR above BB Center, PSAR under price), you might consider entering a long position.
Stop Loss (SL): Set the stop loss at the current level of the PSAR dots to manage risk.
Monitor My Idea: Keep monitoring my idea for any changes in trend or for potential profit-taking opportunities.
Thank you!

GRASS/USDTKey Level Zone: 1.8510 - 1.8670
HMT v6 detected. The setup looks promising, supported by a previous upward/downward trend with increasing volume and momentum, presenting an excellent reward-to-risk opportunity.
HMT (High Momentum Trending):
HMT is based on trend, momentum, volume, and market structure across multiple timeframes. It highlights setups with strong potential for upward movement and higher rewards.
Whenever I spot a signal for my own trading, I’ll share it. Please note that conducting a comprehensive analysis on a single timeframe chart can be quite challenging and sometimes confusing. I appreciate your understanding of the effort involved.
Important Note :
Role of Key Levels:
- These zones are critical for analyzing price trends. If the key level zone holds, the price may continue trending in the expected direction. However, momentum may increase or decrease based on subsequent patterns.
- Breakouts: If the key level zone breaks, it signals a stop-out. For reversal traders, this presents an opportunity to consider switching direction, as the price often retests these zones, which may act as strong support-turned-resistance (or vice versa).
My Trading Rules
Risk Management
- Maximum risk per trade: 2.5%.
- Leverage: 5x.
Exit Strategy
Profit-Taking:
- Sell at least 70% on the 3rd wave up (LTF Wave 5).
- Typically, sell 50% during a high-volume spike.
- Adjust stop-loss to breakeven once the trade achieves a 1.5:1 reward-to-risk ratio.
- If the market shows signs of losing momentum or divergence, ill will exit at breakeven.
The market is highly dynamic and constantly changing. HMT signals and target profit (TP) levels are based on the current price and movement, but market conditions can shift instantly, so it is crucial to remain adaptable and follow the market's movement.
If you find this signal/analysis meaningful, kindly like and share it.
Thank you for your support~
Sharing this with love!
HMT v2.0:
- Major update to the Momentum indicator
- Reduced false signals from inaccurate momentum detection
- New screener with improved accuracy and fewer signals
HMT v3.0:
- Added liquidity factor to enhance trend continuation
- Improved potential for momentum-based plays
- Increased winning probability by reducing entries during peaks
HMT v3.1:
- Enhanced entry confirmation for improved reward-to-risk ratios
HMT v4.0:
- Incorporated buying and selling pressure in lower timeframes to enhance the probability of trending moves while optimizing entry timing and scaling
HMT v4.1:
- Enhanced take-profit (TP) target by incorporating market structure analysis
HMT v5 :
Date: 23/01/2025
- Refined wave analysis for trending conditions
- Incorporated lower timeframe (LTF) momentum to strengthen trend reliability
- Re-aligned and re-balanced entry conditions for improved accuracy
HMT v6 :
Date : 15/02/2025
- Integrated strong accumulation activity into in-depth wave analysis

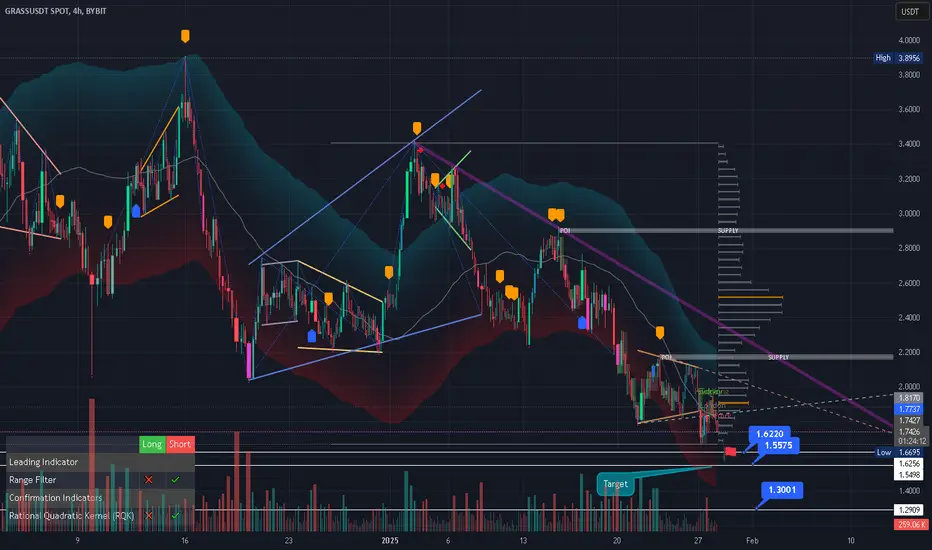
GRASS Looks Bearish (4H)From the point where we placed the red arrow on the chart, it appears that the GRASS correction has begun. The pattern is either an expanding triangle or a diametric. Wave G could complete within the red zone, leading the price into Wave E. Wave E is a bearish wave.
A daily candle closing above the invalidation level will invalidate this analysis.
For risk management, please don't forget stop loss and capital management
Comment if you have any questions
Thank You

#GRASSDue to the bad market conditions, I think these targets will be achieved unless there is good news that changes the market trend.
And you should keep in mind that these targets will not be reached very quickly and will take time.
#GRASSIn my opinion, this is a good coin for swing trading and scalping. But it is not in a good condition right now.

#GRASS The best trading range for scalping
In my opinion, this coin is worth investing in and is better than many meme coins.
I don't recommend holding because no coin is worth holding except btc, Sui and Sol.
Don't rush to buy, I think there is still room for it to fall.

#grass purchasing areasexcellent areas for long positions, judging by the structure of volumes in the past
put limits in both areas with a stop at the bottom of the structure

GRASS/USDTKey Level Zone: 1.9800 - 2.000
HMT v4.1 detected. The setup looks promising, supported by a previous upward/downward trend with increasing volume and momentum, presenting an excellent reward-to-risk opportunity.
HMT (High Momentum Trending):
HMT is based on trend, momentum, volume, and market structure across multiple timeframes. It highlights setups with strong potential for upward movement and higher rewards.
Whenever I spot a signal for my own trading, I’ll share it. Please note that conducting a comprehensive analysis on a single timeframe chart can be quite challenging and sometimes confusing. I appreciate your understanding of the effort involved.
Important Note :
Role of Key Levels:
- These zones are critical for analyzing price trends. If the key level zone holds, the price may continue trending in the expected direction. However, momentum may increase or decrease based on subsequent patterns.
- Breakouts: If the key level zone breaks, it signals a stop-out. For reversal traders, this presents an opportunity to consider switching direction, as the price often retests these zones, which may act as strong support-turned-resistance (or vice versa).
My Trading Rules
Risk Management
- Maximum risk per trade: 2.5%.
- Leverage: 5x.
Exit Strategy
Profit-Taking:
- Sell at least 70% on the 3rd wave up (LTF Wave 5).
- Typically, sell 50% during a high-volume spike.
- Adjust stop-loss to breakeven once the trade achieves a 1.5:1 reward-to-risk ratio.
- If the market shows signs of losing momentum or divergence, ill will exit at breakeven.
The market is highly dynamic and constantly changing. HMT signals and target profit (TP) levels are based on the current price and movement, but market conditions can shift instantly, so it is crucial to remain adaptable and follow the market's movement.
If you find this signal/analysis meaningful, kindly like and share it.
Thank you for your support~
Sharing this with love!
HMT v2.0:
- Major update to the Momentum indicator
- Reduced false signals from inaccurate momentum detection
- New screener with improved accuracy and fewer signals
HMT v3.0:
- Added liquidity factor to enhance trend continuation
- Improved potential for momentum-based plays
- Increased winning probability by reducing entries during peaks
HMT v3.1:
- Enhanced entry confirmation for improved reward-to-risk ratios
HMT v4.0:
- Incorporated buying and selling pressure in lower timeframes to enhance the probability of trending moves while optimizing entry timing and scaling
HMT v4.1:
- Enhanced take-profit (TP) target by incorporating market structure analysis

Buying grass hereIt has touch four hour demand zone and am buying from here. For any possible downward movement use small leverage for future but for spot go and sleep.


GRASS USDTConsidering that this currency hit the bottom of its last peak in the one-hour time frame, it has the conditions for further correction and we can be sellers.

GRASSUSDT Perp IdeaI’m entering a short position here, expecting the price to reject off the 2.8144 resistance level. My stop loss is placed slightly above at 2.8312, which provides a safety buffer in case of a minor fakeout. The take profit target is down at 2.5394, aiming for a clean reversal and continuation of the bearish trend. This gives me a favorable risk-reward ratio.
What Could Go Wrong:
Breakout Above Resistance:
If the price breaks above 2.8312 and reaches the stop loss, the trade setup will fail. A strong bullish breakout would invalidate the bearish scenario.
Weak Rejection or Consolidation:
If the price consolidates around the resistance without a clear rejection, it may indicate indecision, making the trade less likely to hit the target.
Stop-Hunt Risk:
A brief spike above the resistance to trigger stop losses (including mine), followed by a bearish move, is a potential risk. This could result in a loss despite the overall direction being correct.
Unexpected Market Catalyst:
Any sudden news or event could shift market sentiment, causing volatility and possibly invalidating the technical setup.

GRASSUSDT - Doji. Not a trading adviceGrassusdt gave us a doji candle, from theory, there should be reversal, from practice, it appeared during strong bullish trend. Is there going to be a reversal soon? Let's find out!

#GRASS/USDT Ready to go higher#GRASS
The price is moving in a descending channel on the 1-hour frame and sticking to it well
We have a bounce from the lower limit of the descending channel, this support is at a price of 2.20
We have a downtrend on the RSI indicator that is about to be broken, which supports the rise
We have a trend to stabilize above the moving average 100
Entry price 2.36
First target 2.46
Second target 2.55
Third target 2.65

GRASS. Support Tested, Resistance in Sight. 12/24/24BYBIT:GRASSUSDT
The asset price has returned to the price range where support from buyers was previously observed. Support is a level where buyers are willing to purchase the asset, halting its decline.
In this case, the range is $2.3437–$1.9320, making it a safe zone to accumulate spot positions, at least targeting the nearest resistance level at $3.4860. Opening a swing position can also be considered.
I expect a reversal pattern to form at this support level, signaling a potential trend shift from bearish to bullish (the structure currently forming is highlighted on the chart).
Projected movement is outlined on the chart.
DYOR.

grass - boxWait for the box to break through and you can enter the position. The target is on the chart. While the price is in the box, it is consolidation.

GRASS triple nested 1-2 ideaI've been closely monitoring GRASS for a potential triple 1-2 setup , as there's a notable resistance at the $3.90 level, which could act as a triple top zone. If a rejection occurs, another 1-2 formation might develop within its micro subwaves. However, this setup presents a strong opportunity, with a realistic and achievable target of $10 .

GRASS BULLISH MOMENTUM!!!The GRASS/USDT chart shows a strong uptrend supported by a rising trendline (yellow) acting as dynamic support. Price is currently consolidating under a critical resistance zone (highlighted in purple), where sellers are active around 3.96 USDT. If the price holds above the trendline and breaks through this resistance, it could trigger a significant bullish move.
Using Fibonacci Extension levels, the potential upside targets are:
- 127.20% (4.88 USDT) as the first target,
- 161.80% (6.27 USDT) as the second target, and
- 261.80% (12.98 USDT) as the extended bullish target if momentum accelerates.
The rejection from the resistance combined with a 14.96% drop signals caution, but as long as the trendline holds, the bullish structure remains intact. A breakdown below the trendline, however, could shift momentum to bearish and invalidate this setup. Keep an eye on the trendline bounce for a potential breakout confirmation. 🚀 #GRASSUSDT #CryptoAnalysis #Uptrend #Trading

GRASS Touching Resistance levelGRASSUSDT is showing signs of a potential short opportunity as it repeatedly tests the 3.830 resistance level. With three unsuccessful attempts to break above this price, a "triple top" pattern has formed, signaling a possible reversal. Traders may look for a short position, anticipating downward price movement.
Trade Wisely

GRASS 1D. Upcoming Airdrop Could Send This Token Soaring Again! The current price is in an accumulation phase, seemingly preparing for a breakout.
The project is expected to conduct a second airdrop soon. During the first airdrop, the token’s price surged significantly, from $1 to $3.
This time, I don’t expect as dramatic a rise, but I believe the token could reach a value between $5 and $7.
Given the upcoming airdrop, I anticipate a potential price increase following this event.
DYOR.

$GRASS to $5$GRASS is on fire right now! The trend is still intact on its bullish momentum, currently trading at $3.30
If price can stay above $3.20 (daily rWAP) , we can see it going to $4.30 to $5
Key support is around $2.92 to $2.83, and $3.5 remains to be the local resistance to break.
Since its launch on October 28, 2024, #GRASS has skyrocketed over 320%. With this bullish momentum going strong, we’re aiming for $5 (short-term)
As #DePIN gears up to become a trillion-dollar industry, @getgrass_io, already in the top 15 DePIN coins, looks set for massive growth.
It’s ranked 130 on CoinMarketCap, but let’s be real—this thing’s got top 20 potential, no matter how crazy the top 20 gets this bull run.
This project is absolutely wild.
If you've been farming $GRASS, you already know the deal—it’s paying off big time! It’s sitting at around $3.3 per token now, and people have been grinding for months to mine it, with some solid rewards to show for it.
The market cap is just $812.86M right now. As of December 15, 2024, the circulating supply of Grass (GRASS) tokens is approximately 243.91 million, representing about 24.39% of the total supply of 1 billion tokens.
The token distribution is structured as follows:
Early Investors: 252 million tokens (25.2% of total supply), locked with a 1-year cliff and a subsequent 1-year vesting period.
Contributors: 220 million tokens (22%), locked with a 1-year cliff followed by a 3-year vesting period.
Foundation & Ecosystem Growth: 228 million tokens (22.8%), with 120 million unlocked at the Token Generation Event (TGE), and the remaining locked for 1 year, then linearly unlocking over the next year.
Future Incentives: 170 million tokens (17%), estimated to unlock linearly over 3 years.
Airdrop One: 100 million tokens (10%), fully unlocked at TGE.
Router Rewards: 30 million tokens (3%), fully unlocked at TGE.
The next scheduled unlock event is on December 28, 2024, releasing approximately 3.71 million GRASS tokens (0.37% of total supply).
These vesting schedules are designed to promote long-term commitment and stability within the GRASS ecosystem.

GRASS looks bullish (4H)It seems that a wave X has completed.
If a pullback occurs to the green zone, we will enter a buy/long position.
The targets are specified on the chart.
A daily candle closing below the invalidation level will invalidate this analysis.
If it stabilizes on ATH, it can have higher targets
For risk management, please don't forget stop loss and capital management
When we reach the first target, save some profit and then change the stop to entry
Comment if you have any questions
Thank You
