TRADE WITH US US AT CRUX ATLANTIC GRIFFAIN/USDT ..........ENJOY
BUY ENTRY ..Buy entry sighnal
RISK MANAGEMENt
5x leverage
GRIFFAINUSDT trade ideas
GRIFFAIN trading plan🟢 Available trading deal
📝 Currency $GRIFFAIN
✅ Entry points for the currency: at the current price of 0.04955 and the reinforcement will be at 0.04335
🔴 Stop loss is below 0.03595
💹 Potential targets: First target 0.0575 and if the currency enters a bullish wave, the target will be towards 0.0750 reaching up to 0.1250
📊 The profit-to-loss ratio is 5:1
📝 This idea is based on Elliott Waves analysis, especially after the rebound from 0.02431, the currency's low, and gaining support at 0.03595, which is a signal that Wave 2 has been formed, especially if the price action remains above the mentioned level
❤️ Good luck to everyone - do not enter any currency before studying the risk ratio you will undertake
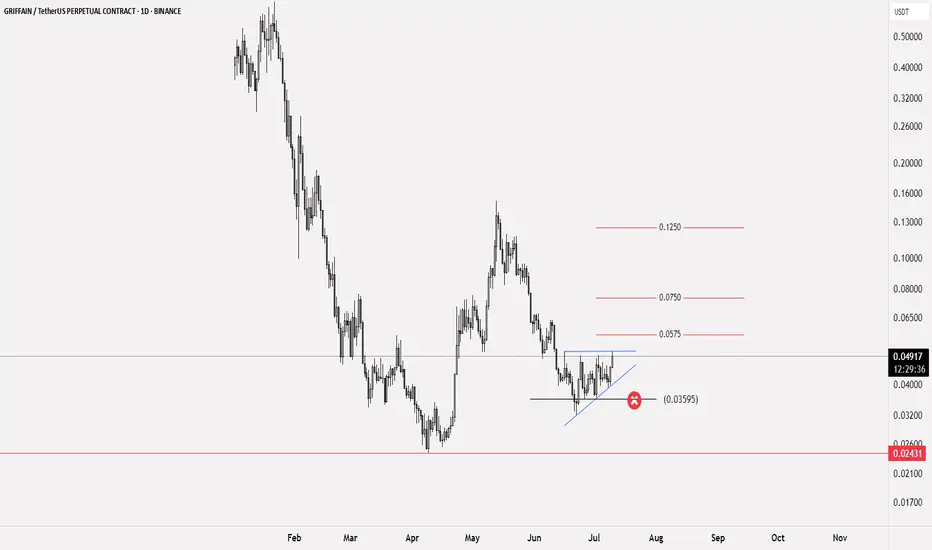
GRIFFAIN Chart Signals Bullish Rally$GRIFFAIN is forming a bullish ascending triangle pattern on the daily chart, signaling a potential breakout. Price is consolidating just below key resistance at $0.048, supported by a strong ascending trendline and a historical support zone.
A breakout above the triangle could trigger a sharp move toward the $0.15 level, offering a potential upside of over 100%-200%. The setup suggests growing bullish momentum and a possible trend reversal.
BITGET:GRIFFAINUSDT


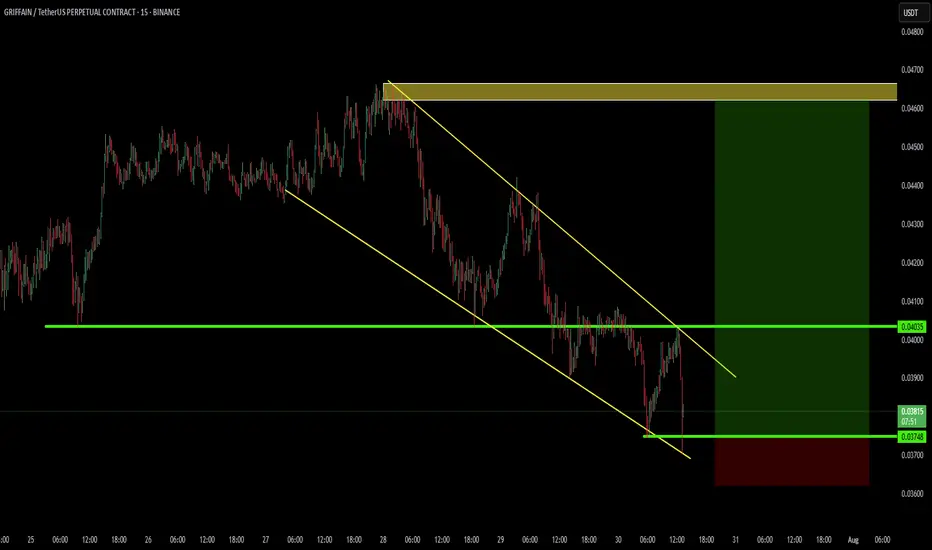
GRIFFAIN BEARISH SETUPGRIFFAIN/USDT (1H Chart) – Distribution Phase Signals Short-Term Bearish Reversal
The 1-hour chart of GRIFFAIN/USDT on Binance displays a distribution pattern at the recent high, suggesting bullish exhaustion and an imminent correction. Price has now broken below the consolidation range, confirming a shift in intraday sentiment.
🔍 Key Technical Insights:
Distribution Zone Formed: Price stalled at the top with several failed attempts to push higher, forming a range – a classic sign of distribution before reversal.
Bearish Breakdown: The bearish candle has breached support, initiating a potential downward move toward the 0.5 Fibonacci retracement level.
Key Level to Watch:
Next Target: $0.0400 (50% Fib level + historical demand zone)
Further Support: $0.0360 (Fib 0.786 region)
📉 Outlook & Expectations:
Short-term bias remains bearish below the $0.0458 zone. As long as price stays below the distribution range, expect continuation toward the $0.0400 support area, aligning with key structural and Fibonacci levels.
This setup is ideal for intraday or short-term swing traders watching for pullback entries or breakdown continuation.

GRIFFAIN/USDT 4H — Crunch Time at $0.087 Support, $0.10 Breakout📉 4-hour look at $GRIFFAIN
Price is parked at $0.0895, right on a demand band $0.087-0.090. Short EMAs (5/10/20) have stacked bearish between $0.093-0.100, so bulls need a close back above $0.100 to flip momentum.
Indicators
• RSI-6 = 28 → deep oversold, room for a dead-cat bounce
• MACD histogram flattening → early signs of seller fatigue
Key levels
Bottom watch: lose $0.087 and liquidity thins fast to $0.075, then $0.050
Upside targets: reclaim $0.100 → eye $0.112 (24 h high), $0.135, and the swing top $0.151
Volume will make or break the setup—spike in buy-side flow could spark a short squeeze. Stay nimble.
#GRIFFAIN #Altcoins #CryptoTrading #MemeCoin #AI #Crypto

Stay Alert From GRIFFIAN.This can be a buyers trap by Griffian.
1-Rsi and structure suggest sell.
2-Use Stoploss,only news impact can hit the stoploss.
3-The breakeven and partial should be done at 1 ratio 1.
4-Never give market full profit and never close trade completely, put some part at breakeven.
Good Luck and Hope All Tp hits.

GRIFFAIN/USDT: 189% Surge In Price— Now What Next?BINANCE:GRIFFAINUSDT.P
On the Daily timeframe, after an extended bearish trend, the price broke out of a falling wedge pattern and surged by 189.92%.
Currently, the price is consolidating just below the daily resistance level (marked by the red dotted line).
The price needs to break above the daily resistance with strong volume for the upward momentum to continue.
Otherwise, a pullback towards the blue support zone is likely.
If the price successfully retests the blue zone and holds, it may attempt to retest the resistance level again.

FRIFFAIN BULLISH TREND UPDATE!!
Griffain has officially broken its long-standing diagonal trendline resistance, which had been holding the price down since February. This is a strong signal that the bearish trend has finally been broken.
The second major sign of this shift is the key support zone that price had tested multiple times before bouncing back up—showing solid rejection and buyer interest.
The third confirmation lies in the price structure itself: Griffain had been forming consistent lower lows, confirming a bearish trend. But now, something beautiful has happened—it failed to form another lower low, and instead, it’s now forming a higher low. This is a classic sign of bullish momentum building and clearly shows that the bearish pressure has been broken.
From here, we expect the price to move upward, InshaAllah.
The yellow lines are our targets, and if this momentum continues, we could even see Griffain retesting its all-time highs—and potentially setting new ones.
Just to highlight the strength of this move: Griffain has already shown a 130% rise in under 7 days, which speaks volumes about the momentum and interest behind this asset. 🚀
InshaAllah, brighter days ahead!

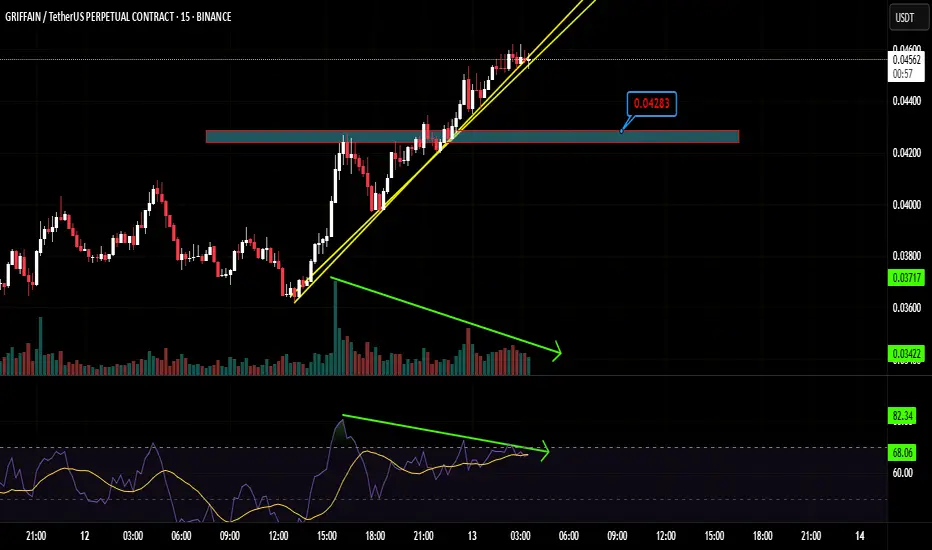
GRIFFAINUSDT.P - SCALP SHORTThe rise on the chart isn’t supported by volume… That’s why I’m expecting this uptrend, which is already moving very close to the trendline, to break down suddenly. At the same time, there’s a bearish divergence on the RSI. So, I’ll be taking a scalp short around the 0.042-0.043 zone with a tight stop-loss.
Griffian Good SetupThis coin is shorting and repeating same pattern of sell but now there is chance to
get this move upwardly and good gain.

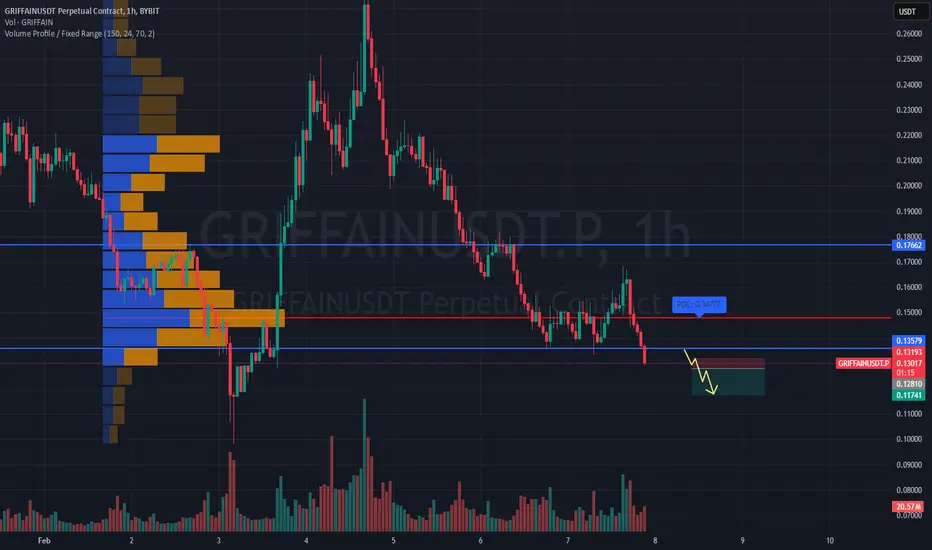
SHORT #GRIFFAINUSDT expecting further downside📉 SHORT BYBIT:GRIFFAINUSDT.P from $0.12810
🛡 Stop loss $0.13193
⏱ Timeframe: 1H
✅ Overview:
➡️ BYBIT:GRIFFAINUSDT.P is showing weakness after reaching a local high, rejecting from a resistance zone.
➡️ POC (Point of Control) at 0.13193 acts as a key volume area with significant trading activity.
➡️ Price action suggests seller dominance, indicating a potential continuation of the downtrend.
➡️ If the 0.12810 support level breaks, expect an increase in bearish momentum.
⚡ Plan:
➡️ Short entry upon confirmation of a breakdown below 0.12810.
➡️ Increased selling volume will confirm the continuation of the bearish trend.
➡️ Holding the position with dynamic monitoring until the first Take Profit level.
🎯 TP Targets:
💎 TP 1: 0.11741 – first target based on the nearest support level.
📢 BYBIT:GRIFFAINUSDT.P is showing bearish signs, but volume and pullback dynamics should be monitored.
📢 A break below 0.12810 could trigger a deeper decline.
📢 If buyers show strength, watch 0.13193 as a possible reversal point.
🚀 BYBIT:GRIFFAINUSDT.P maintains bearish momentum — expecting further downside!
GRIFFAINUSDT Reversal Incoming! 100%+ Potential!🚀 GRIFFAINUSDT – A Prime Reversal Zone with Massive Growth Potential! 🚀
The market structure of GRIFFAINUSDT is showing clear signs of a potential bullish reversal, making this an exciting opportunity for investors looking to capitalize on a breakout rally.
📉 Current Market Sentiment:
The price has retraced into a strong demand zone, aligning perfectly with the Strong Low support level.
Historical price action suggests this level has previously acted as a reversal point, making it an ideal area for accumulation.
The discount zone further indicates a value-buying opportunity, as smart money often enters at such discounted levels.
📈 Bullish Signals:
Break of Structure (BOS) indicates the possibility of a trend shift.
The price is currently hovering near the Nadaraya-Watson Envelope’s lower band, a key dynamic support that has historically triggered upward momentum.
A move above equilibrium levels could ignite rapid upside movement.
🎯 Price Targets:
Short-Term: A swift 100% gain from current levels as buying pressure builds.
Long-Term: Given the supply-demand dynamics and previous price action, a surge toward $2–$5 is within reach as the market recovers.
💎 Investor Takeaway:
The current technical setup is incredibly favorable for a bullish reversal, and smart money is likely eyeing this zone for accumulation. With strong fundamentals and technical backing, this could be a golden opportunity to enter before the next explosive move!
🚀 Don't miss out on this potential moonshot! 🚀

GRIFFAIN - About to take off? GRIFFAIN is an AI agent project on Solana blockchain. The price has been consolidating since 13th Dec and the price has broke above the resistance line at $0.35. The current chart set up in Daily timeframe looks to me exactly the same as that of ai16z on 27th Dec when the price skyrocketed from $0.90 to the current price of $1.72. MACD crossed above 0 level and showed green histogram bar, and RSI and Stochastic both crossed and clearly pointed upwards in the bull territory. That all three momentum indicators show clear bull signal in Daily chart doesn't happen often. I invest in this project and do not intend to do short term trading wit this asset. I think another parabolic leg is coming just like ai16z. I might take small profit if momentum indicators start to show clear negative divergence in 4H or daily chart, but I intend to hold most of my position until it reaches 1 billion Market cap.

GRIFFAINok, lets do a tricky trade, last time griffain did a 20% correction and a pullback of 40%
last night did 16% correction and i am thinking that rn it will at least 35% pullback Long..
after midnight i will see how bitcoin it will work and i will see if this is a possible Long Trade
nfa
dyor

GRIFFAINi think griffain must return to TP1
i just opened a short position with 2% SL
volume is decreasing, so why not try to have some profit..
be cautious and play only 10-15% of your bag.
please take care about your money, nfa - dyor

Griffain 1 Day Chart Bullish Flag Griffain Usdt Day Chart Tp and Sl are mentioned and can purchased immediately
Manage Your Risk According to Your Portfolio. .
Happy Trading


Symmetrical Triangle breakout SoonAfter reaching a high two weeks ago and a subsequent sell off GRIFFAIN has been in a symmetrical triangle pattern. A break above $0.30 could lead to an upward target of $0.50 cents and higher $0.60. I forsee the breakout as imminent!
