GRT Bullish News + Bullish FundamentalsBullish News: The Graph Protocol has just unveiled "Curation" which is now live alongside Graph Explorer and Subgraph studio. These are HUGE development releases that is very bullish for GRT.
Bullish Fundamentals: GRT has broken, retouched, and bounced off it's 30 day moving average. The GRT/BTC pair confirms a move up is imminent.
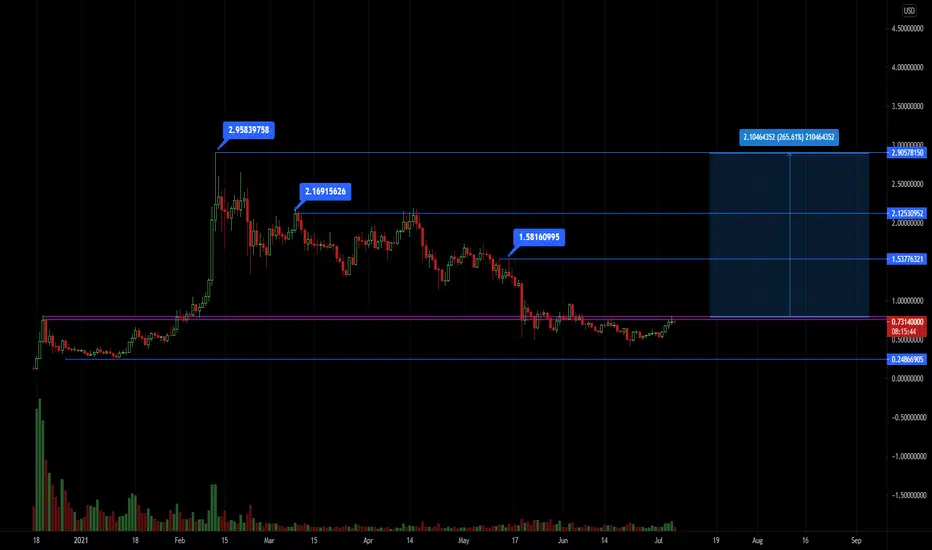
Best Case Scenario: If GRT can hold an RSI above 50 and bitcoin can hold its current levels and/or move up...GRT should be seeing a fairly violent move upwards. My target is the last major support (now resistance) prior to the May 19th Bitcoin crash.
Worst Case Scenario: If bitcoin crashes, I think the bullish news can limit losses on GRT's USD pairing and maintain it's upward trajectory on it's BTC pairing.
As always, this is just my opinion and not financial advice!
GRTUSD.P trade ideas


ALT TIME $$ GRT $$COULD SEE A PUSH TO .73-.77 TODAY. Volume looks good , broke resistance. with BTC still lingering , alts can do there own thing. JUST BE IN AND OUT!

GRT breaking down after rallyGRT closed 1H candle just below the support band of the triangle. Price can play around here, but if you look at the GRT:BTC pair you can see GRT hitting a potential top today.
Expect the price to go lower.
I am short here, not advice.

GRT Recovery Rally -Revised EW Idea - buy around 62 centsFollowing up on my previous idea - The stars are aligning for this idea to work out pretty well if BTC allows for it.
If we want to follow elliot wave rules, we could potentially retrace to about 62 cents, and cannot close more than a wick below that point to follow EW. The 62 cent area is strong support resistance - and is also the golden pocket. The stars really are aligning for this.
I will attach my previous ideas to this for further explanation and details. Plenty of S/R and fib detail in chart.

The Graph Protocol analysis. $GRTThe Graph Protocol has had a pretty significant retrace from the highs early this year. One thing that is concerning about GRT is the tokenomics are very poor. Over the span of 2021 around 5 billion coins will be released into the circulating supply. This will most definitely have a impact on price of the coin.
COINBASE:GRTUSD A couple levels to watch for, you would really only want to buy GRT above 80 cents with strength or buy at the 2021 lows.
Right now price is sitting in no mans lands and it would be risky to buy at this level.
GRTUSD - Recovery Rally Update 2Hello!
GRT has been wonderful to anyone who has been trading it from below!
I have a couple of ideas that I will attach to this one - there are many updates within it, and that is where the good info is. I personally averaged in and have plenty from below, and still had buys below that never went through. I am in the positive now regardless, and this is why I choose to average in and out instead of all or nothing.
Right now I think that we get our first decent sized retrace on this run for GRT.
It looks like they may do an Elliot wave type move, and if so, we shouldn't go any lower than 62.4 cents on this retrace. (only a wick into that area that is if we want to follow the EW wave rules)
If not, well, they probably take it close to the .618 for this retrace. There is very good S/R around 62 cents, so this is setting up quite nicely for an EW type move.
Once we do this 4th wave correction, I think that we go and test the trendline, and the next S/R area which goes roughly from about 75 cents to about 96 cents. Depending upon how BTC allows these rallys to take place, we could potentially make it as far as I thought that we might in my original idea, into the 1.20's and even into the 1.50's.
This is with the assumption that BTC does a recovery rally to fake everyone out, and it ultimately fails and everything eventually puts in its true bottom afterward.
So, watch this retracement closely, and do your best to squeeze as much out of this move as possible if they allow it to happen.
I will post updates within this idea as more develops. It is very hard to capture all of the details and ambiguity made in these markets with one single idea - but anyone who trades or does markets regularly would probably know this.
Thank you!

GRT Bottom! LONGit is my opinion we have bottomed in GRT. You can Long it Here for a short term trade. Personally, I hold an enormous stack for the longer term and delegate to the network and have recently bought some once again at about $0.51 after buying at $0.35 when it first started trading and selling all of it at $1.94 a few months back. Lets Go!!


GRT - $1.37GRT is currently trading just below the resistance level of $0.5869. If it can flip this resistance zone to support, we could start seeing a move towards $0.6058, $0.6301, $0.6647, $0.7088 and $0.8360. If $0.8360 can be flipped to support, we could start seeing a bigger move towards $1.0419, $1.2478 and $1.3750. Failure to break the resistance at $0.5869 could lead to a drop towards $0.5515 and $0.5029.

A Calculated Use of ColorAre you tired of that drab green and red on black workspace? Do you wish you had a little more color? I did and I also took action and developed what I believe is a near perfect (for me) composition of indicators and, most importantly, of colors. Going from top to bottom, the indicators I use are...
First of all, I used a black background, a part of the "dark" theme option, but with the hue slightly altered. The black allows the colors to pop out better, creating smoother contrast than white and also easier on the eyes over extended viewing times. Next we have...
MACD (orange, blue and white)
EMA's (red, green, purple and deep magenta)
VWMA (yellow)
Bollinger Bands (forest green)
Parabolic SAR (deep pink)
Trendlines (white; all primary lines are white because it contrasts nicely; secondary, etc. lines can be any color)
Volume w/ Moving Average (rusty orange, blue with the white line representing a moving average)
BJ RSI (red, green, yellow, blue, white, orange and white)
RSI 14-Close (not visible, but below the BJ RSI; easily switch between the two in the same space)
ADX on DI (red, green and white)
Additionally, in main settings, in "scales," you can select "Indicator Last Value Label" and you can add a splash of randomized color to the price bar.
When chart analysis takes precedence over indicators, one may simply double click on the main screen (in the background) and the indicators will disappear. Double click again to have them return.
Many of you reading this may find my setup a little to busy, with too much going on at once and in minimal space. For me, personally, that's exactly how I like it and I've become adept at reading every indicator despite how many there are in number. It's much more efficient than using one at a time!
Some may be wondering how I customized everything, from color to opacity, and the answer is simple. Everything on your screen, including every single solitary indicator, has a "settings" option. Selecting this will make "style" available at the top of the pop-up and then you can adjust as you please. When choosing a new script/indicator from the public library, you can *almost* always change the appearance of it, as well as the ability to adjust important "inputs." It is important to note that, for a screen as complex as my own, blending the colors together with the "opacity" function is extremely useful.
Finally, so many people use "light" for their theme. I say come to the "dark" side and let those colors pop!
Thanks for coming to my TED Talk: Polychromatic Fun and Stuff

The Graph - The Bulls Are Ready To Play Analysis:
- Reverse Fibonacci Retracement
- Support & Resistance
-Trendline Analysis
- Order Block Flow Analysis
Inflection: $1.1357
Bull Cycle Begins: $1.5657
Buy Scale Ins: $1.8856 / $2.1122 / $2.3388
Opinion:
The Graph is gearing up for a beautiful BULL run
The Graph is another long term hold coin for me
Some call it the "Google" of crypto
I am buying coins myself at these super cheap prices and I will probably scale more buys as we move up
Let the games begin :)

GRTusdGRT is in a bearsih movement this coin has a chance for the upside but by the looks of the graph im guessing it might keep going down.

GRTUSD - Bearish Scenario - Triangle Break-outUnfortunately, it does look like we have a couple of 4 hour candle closes below our symmetrical triangle for GRTUSD.
This would make for about a 45% drop to the low to mid 30 cent area.
We may see a test back up to about 60 cents to test the bottom of the triangle and the S/R thereabouts.
I've had many fib hits in the 20 cent area, too, and I would consider that the prime opportunity.
I would expect to consolidate maybe for a bit in the 30's, maybe initially get a wick down toward 20 cents, who knows.
My buys are scatted down to 20 cents, personally.

GRTUSD - Recovery Rally Plans Updated (bear scenario included)GRTUSD still sits in this great accumulation area.
It has hit an intermediate term 4.236 square in the nose.
A person that collaborated with me on my previous analysis had pointed out that GRT was in a symmetrical triangle at the time, and that is why they could see the 30 cent area. Since then the structure of the triangle has changed a bit, and I have done my best to illustrate it here in this analysis. If we break down to the downside, then we have a great chance of hitting 30-38 cents IMO. (to match a 47% downside move via the triangle and also a fib hit at about 36-37 cents)
The triangle still has good confluence with a move to the upside of about 87%, which takes us into the 1.20's, which I was anticipating before.
I still think that a very likely scenario to play out is a recovery rally for BTC and alts, where everything ultimately gets rejected after some upside, and then we continue down to our final bottoming targets. The final downside targets that I see for GRTUSD for right now are within the 20-40 cent area. I have personally placed buys in that area, and will add to those buys if we get this recovery rally.
I think that the dollar may take a breather on its recovery rally, and let BTC do its own recovery rally.
So - in the meantime, GRTUSD needs to break the symmetrical triangle downtrend (in green) that it is in - establish support above 75 cents, and then take a stab at the big picture downtrend (in red) that it is in. From there I could see it testing the 1.20's where I think that it will ultimately fail, and head back down to test this accumulation zone again, where we may even see the lower targets of 20-40 cents at that time.
Didn't read all of this? Upside $1.20's Downside 20-40 cent area.
Thanks!

GRT LONG IDEAStrong fundamentally solid project that has retraced it's entire impulse move.
This will take a while to pan out so spot or futures until the end of the year.
Let's see

Bullish Shark Entry at 58 CentsIf we get down to to around 59-58 cents i will Begin to buy. Stoploss Below 54 cents.

GRT: Waiting for the bottom confirmationThere could be several ways the price action can play out. By looking at the overall market, I am watching for two specific paths. One path could drag out this current accumulation zone with wicks up and down but weekly candles within the box. Or there could be a flush out and then move upwards and onwards. Either case, the buy signal will be when ADX curls up and Green DI plus crosses above Red DI Minus. At the same time price needs to move into the top half of the channel. Above $1.18 is game on. Not looking to catch the bottom by any means. Still holding some that I bought during January breakout around the same price as now. Like the rest of the crypto market, it is a waiting game for me. Good luck out there.

LONG GRTPaper handed by LINK longs...BTC 1D and 3D shaping up to look great.
Already got chopped up once this weekend, hope I don't re-enter into more resistance here...
Longed at $0.623, looking for targets around $0.86 and $1.11

GRT - Symmetrical Break outSeeing GRT come to the end of a symmetrical triangle, I'm seeing a .71 rise to the 1.4-1.5 range which coincides nicely on the FIB

long from here!I apologize about the terrible lines , my mouse was having problems. How ever I believe we are up from here on GRT! Big money came out to play..my prediction is back to 1$ by end of week
happy trading! let me know your thoughts :)

GRTUSD - Accumulation Area - Recovery Rally Plan(s)GRT is still in this wonderful accumulation zone, and I hope that you all have had a chance to grab some here.
There is a good enough case to say that this is the bottom, but there is also a good enough case to say that this is just a stop before one last washout, too. The Fibonacci's are giving me a good suggestion that these potential ideas may play out.
I do think that this is at least an intermediate bottom where we will see a nice sized recovery rally. This could serve as an area for a big swing trade, or also a good area to just accumulate for the rest of this cycle once it resumes.
This idea is anticipating a potential recovery rally to the top of this accumulation zone at approximately 90 cents to 1.00 area. This would be where it may fail at the trendline and S/R.
I would think there is a good possibility that we do a bigger recovery rally where we test the major S/R in the 1.20-1.50 area. Then if that fails (where BTC fails to establish support above the 20 week MA), this would provide us the trip down to the final washout destination, which I think could be anywhere from 10-30 cents.
Of course, we may just go bullish from here, or we may just collapse and die, too.
This is my personal plan, and hope that it is helpful.
Thanks!
