GRT Main Trend (addition) Double Bottom + Triangle 08 2025Logarithm. Time frame 1 week.
Main trend . Supplement for clarity to the previous idea for this cryptocurrency, published 23 02 2025 Everything is essentially the same, the new idea is made to visualize the trend, nothing more.
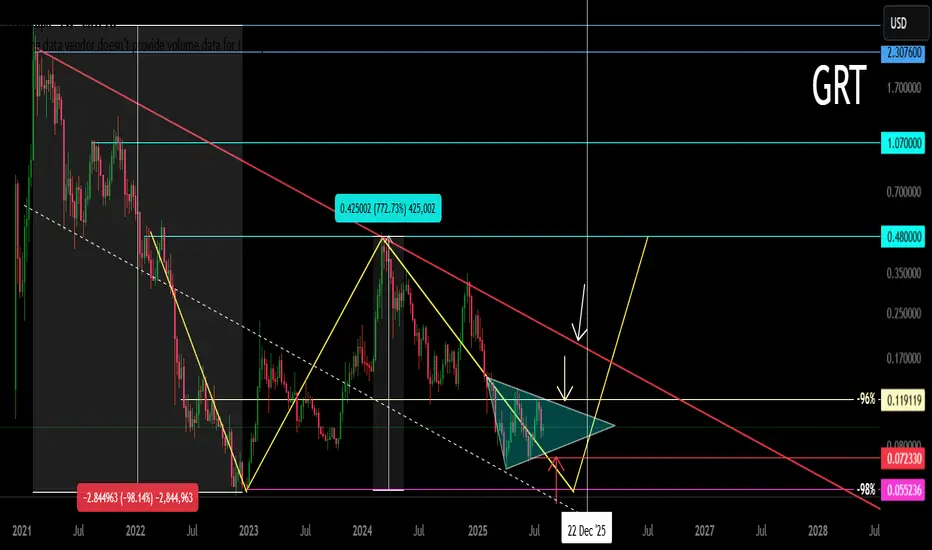
GRT Main trend.
Line chart, price now
Secondary . Big double bottom (in any case, with local scenario A or B, it will be realized in the medium term).
Local trend (price movements in the trend minimum zones before a big pump). Triangle above the Gann fan ray (see the previous idea, where this tool of the logic of movement in the trend is shown).
The second wave of the triangle is formed.
A downward breakout is a descending pennant, which is the removal of longs under the pattern of a larger scale of historical minimums.
A upward breakout is the realization of the triangle targets, and the price movement to the descending line of the main trend +80-100%
GRTUSD trade ideas
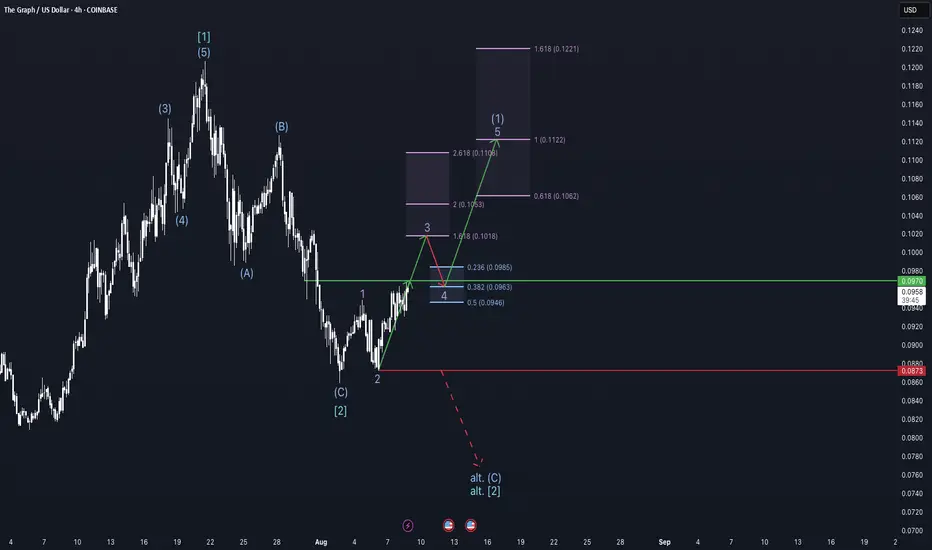
Chasing new highs - GRT weekly update August 8 - 14thThe Graph (GRT) has formed two higher-degree 1–2 setups — one at the Cycle degree and one at the Primary degree — creating a structurally bullish foundation. At the Intermediate degree, price is currently advancing in Wave 1, while at the Minor degree, it is in Wave 3, the most dynamic phase of an impulse. This alignment of early waves across degrees suggests a potentially strong continuation if key resistance levels are broken.
The immediate bullish confirmation comes from a break above the $0.097 resistance, which would open the door for a sustained rally toward the $0.106–$0.122 zone, based on Fibonacci extensions. However, there is an alternative scenario: if the market fails to clear $0.097 and sells off, breaking the $0.0873 support, it would indicate that Intermediate Wave C and therefore Primary Wave 2 are not yet complete. In that case, a final low to complete the larger correction would be expected before the uptrend resumes.
From a sentiment perspective, funding rates are positive, and open interest is rising, showing increasing long exposure. The liquidity heatmap reveals significant liquidity resting below current price, with only minor clusters above — a configuration that could invite a short-term liquidity sweep before continuation.
This setup also needs to be viewed in the context of broader macroeconomic conditions. For much of this year, capital inflows into crypto were limited by the Federal Reserve’s restrictive monetary policy. However, the CME FedWatch Tool now shows a 89.1% probability of a rate cut at the September FOMC meeting. Markets tend to front-run such events, and this expectation could fuel Wave 3 advances across the crypto sector. But with anticipation running high, there is also the risk of a sell-the-news reaction, particularly if retail traders over-leverage into the move.
It’s worth noting that this structure in GRT closely mirrors many other altcoin charts at the moment — a sign of high correlation within the crypto market.
As long as the $0.097 resistance is broken and the $0.0873 level remains intact, the probability favours the bullish scenario — with a multi-degree Wave 3 advance potentially underway, fueled by both technical structure and macro catalysts.
How is GRT doing - $0.24 Soon?GRT is not an asset I enjoy dissecting too much these days, its current nature leaves a lot to be desired.
Bullish structures form prematurely and fail to reach their intended targets, while the bearish structures push deep, retrace wide, and even overshoot targets. Generally speaking, that’s behaviour you don’t want on your side.
But, there’s hope.
We didn’t break below the swing low, and more importantly, we finally broke the downside trend—marked out in white.
So now the question is whether the recent momentum from BTC can spill over to the alts. For now, that looks unlikely, as we reacted right on the dotted TP line inside a resistance zone.
Simply put, I’m expecting a short correction here.
Looking at the previous pink and blue structures, I wouldn’t be surprised if GRT finds strength on the orange TS (Top Support) to keep pushing upwards. However, I don’t see a premature reacting structure aiming for that next major resistance at $0.24.
For that, I’d want to see a turning zone hit and confirmed first. If we react early, I’d strongly advise heavy TP at the swing high—the starting point of the trend.
Bullish idea invalidation: a clear touch of the orange BS line.
Stay focused.

Can the Graph chart a recovery rally into resistance?Quite a few multiples if it can!
Entires in the support band represent low risk entries
(compared to last cycles elevated valuation's)

$GRT IS ABOUT TO GO Graph ( JSE:GRT ) is about to go. Zoom in and out and see it for yourself. History will always repeat itself. You can see the short term targets

GRTUSD - Falling WedgeA falling wedge idea
I think the down trend in white will be retested before the true breakout
After that the falling wedge pattern can act on its bullishness
Daily chart

GRT black structure continues to bring it further down...Another lower low for GRT means another trading opportunity on the table. The black targets from the overarching structure still stand tall, patiently waiting to be reached. This is exactly why we trade anti-cyclically—the possibilities are endless, and the markets just keep on giving.
Never chase. Prepare accordingly and let the market come to you. That’s how the game is played. Watch. Wait. Win.

GRT IS A GOOD ENTRY POINT 2025HELLO. What I can see is something good for this year, I'm sure of this event that is about to happen do your investigations, It's not an investment rabbit but everything I did in the CHART of 3,6,12 months my graphics are positive luck IT'S NOT INVESTMENT ADVICE IT'S YOUR DECISION

GRT to daily resistance, target 30+, sl: 16.5daily support held nicely, expecting good bounce from here in mid term

GRT 12H Update. Will we see new ATHs?!As you may have noticed in some of my other analyses, I often use a resistance line. A brief explanation for this can be found at the Chart.
To illustrate this, I’ve marked the resistance line in both the red sequence and the green sequence. I think you can clearly see how significant it is and why it makes sense to realize profits at these levels.
Regarding the current move, we now have our new reversal zone marked in orange. As you can see, we haven’t reached it yet. Therefore, I strongly expect a short move upward, potentially forming a sub-structured sequence, which we can then use to enter the orange reversal zone.
With a new higher high, we would activate the orange sequence. The rest is clear: targets at Point Y and the resistance line on the way there.
Be aware the our red sequence is yet to be invalidated. Eventhough i dont see it playing out in GRT, it still technically is a viable option.

Is GRT Dead?!Expectation:
If GRT cannot stabilize within the Green GKL, the structure will collapse, and we will continue the overarching downward movement towards the red target levels.

GRT Bullrun over...doubt itPullbacks are normal in crypto. Big moves fast and hard...the way we like it. Might slow down soon. See what market close brings.

[GRT] THE GRAPH could manage to rise up (+185%) to (+260%)If GRT can mantain its price above $0,32 in a weekly candle close that is above 2024 value area high and anchored vwap from may 2021 high would suggest a increase up to $1 region.
The momentum is shifting to bullish in the monthly timeframe and moneyflow increasing. The target is between fibonacci retracement levels pull up from nov 2021 high to 2022 bear market lows alongside with value area high from 2021 last tops.
TARGET: $0,8475 to $1,063 up to (+260%)

The Graph Getting Ready While the market has be experience some volatility we now wait for GRT to make a break on the resistance, it nearly there and hopefully once it clears it we can enjoy the rise up before coming face to face with another resistance

GRT about ready for a 2xThe Graph loves data and loves December! Pump incoming...look beyond the trees to see the forest. Position getting bigger : )

TheGraph Protocol- The Graph Protocol is a decentralized indexing protocol for querying blockchain data. It allows developers to efficiently access and retrieve data from blockchains like Ethereum without building complex data-fetching solutions.
- When GRT was introduced, it was often referred to as the "Google of the Blockchain" due to its role in efficiently indexing and querying blockchain data, much like how Google organizes and retrieves data from the web.
- So, GRT is bullish like most altcoins but lagging. It needs to break out of this Yellow triangle to confirm upward momentum.
----------------------------------------------------------------------------------------------
Trading Part
----------------------------------------------------------------------------------------------
- Buy a breakout after 0.3$ ( and wait weekly candle confirmation )
- Wait for a dip and buy 0.15$-0.14$ (30% invest)
- full invest (add 70%) 0.05$
----------------------------------------------------------------------------------------------
Take profits
----------------------------------------------------------------------------------------------
- TP1 : 0.3$
- TP2 : 0.5$
- TP3 : ATH
----------------------------------------------------------------------------------------------
Long Term Bull Run TP : 7.5$ - 10$ Max
----------------------------------------------------------------------------------------------
Happy Tr4Ding !

Grt bullishi love how we broke all time low then immediately got back above it then made a new higher high with a new higher low formed. also like that it came back to the golden zone on the fibs and now im targeting back to all time high

AI Cryptos are starting to wake up $GRT $RNDRi did buy both JSE:GRT and SEED_DONKEYDAN_MARKET_CAP:RNDR , nice volume coming in and some talk of listings on more exchanges

GRAPHGood entry , possible breakout and moon in Q1 2025 , still GRTBTC is nowhere near breakout , so might be better to enter later once confirmed to avoid the unnecessary risk.
GL

GRT...The Graph flying highLike this weekly chart. Early breakout play at .2642. Lets see or am too early?

the graphThe Graph (GRT) is an open-source and decentralized indexing protocol for blockchain data. It is designed to enable querying on the Ethereum network. The Graph network also enables developers to build various APIs known as subgraphs for separate queries.
JSE:GRT

GRT/USD Long Position (Long Term)"In this trade, I'm focusing on GRT/USD (blue line) relative to BTC (pink line). As BTC has surged to new highs, GRT/USD has been trading sideways, but I'm anticipating a potential catch-up as BTC shows signs of stabilization. The Graph (GRT) is a decentralized indexing protocol designed to make blockchain data more accessible, enabling applications to query data efficiently and securely. This protocol is particularly valuable in the Web3 and DeFi ecosystems, as it powers indexing and querying for decentralized applications across multiple blockchains.
Recently, The Graph Foundation announced several upgrades, including support for more blockchain networks beyond Ethereum, such as NEAR, Binance Smart Chain, and Polygon, which could increase its utility and adoption. Additionally, the launch of new subgraph features and partnerships with major Web3 projects have positioned The Graph as a crucial infrastructure layer for decentralized applications.
With these developments in mind, I see an opportunity for GRT/USD to gain upward momentum, especially as the Web3 space continues to expand and demand for indexing services grows. This trade aims to capture GRT’s potential rally as BTC's pace slows, allowing GRT to close the performance gap and capitalize on its recent project growth."
This description provides a comprehensive look at the project, highlighting both the technical details of The Graph and recent news that could drive value in GRT.

The Graph (GRT)The Graph is an indexing protocol for querying data for networks like Ethereum and IPFS. GRT has a high growth potential and should keep an eye on it. It seems the downtrend phase is ended; after an upward impulse wave started price entered a corrective wave in a triangle-shaped pattern. Let's see if price can break this triangle.
