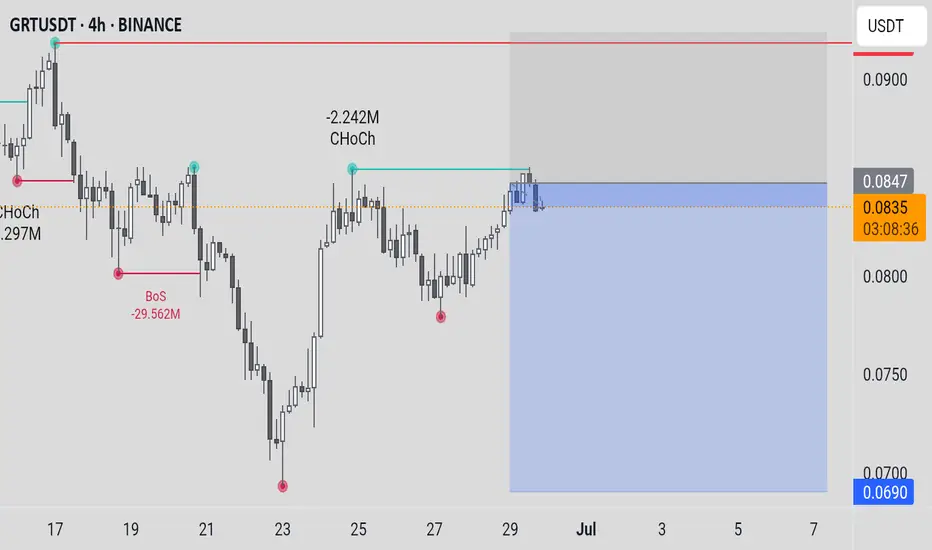
Is a Breakout Imminent for #GRT or Another Bull Trap is Ahead?Yello, Paradisers! Are we looking at a clean breakout setup that could send #GRT flying or is this the perfect trap to wipe out early bulls? Let's see the latest #GRTUSDT moves:
💎The daily chart on #GRTUSD is showing a perfectly formed descending channel, with price now hovering just above the lowe
Related pairs

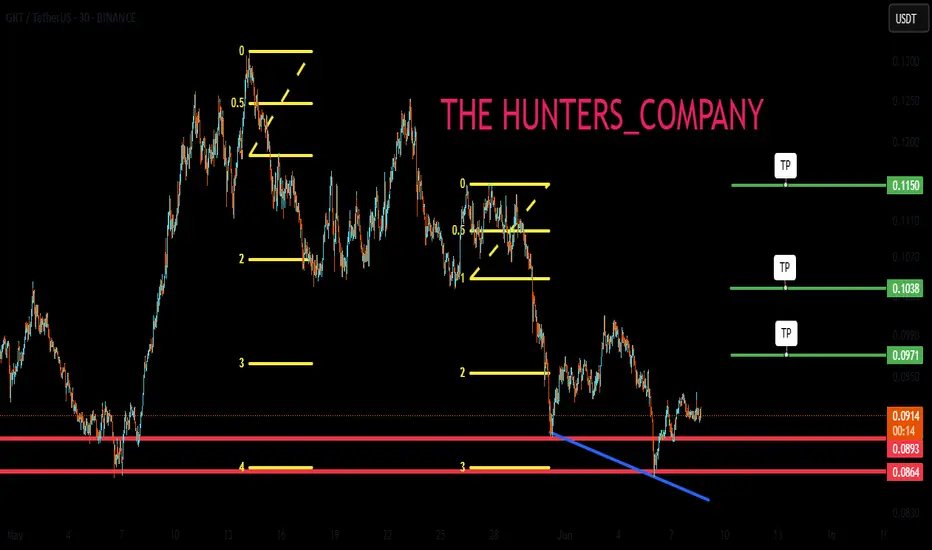
GRT/USDT Short Setup – Fib Reversal Play + Divergence Signals Targeting a short entry on GRT/USDT after key signs of exhaustion and overextension.
🔹 Fib Tool anchored from local bottom at ~$0.08185 to top ~$0.10015
🔹 Currently testing 0.236 retracement at ~$0.09650 after rejection near top of BB
🔹 Bearish divergence forming on RSI (Lower High) vs. price (High

GRT/USDT at a Critical Point! Reversal Structure or Breakdown?📊 Full Technical Analysis – GRT/USDT (1W Timeframe)
🔎 Overview:
GRT is currently positioned at one of the most critical technical levels in its long-term structure. After a prolonged downtrend from the $2.88 all-time high, price is once again testing the historical demand zone between $0.07 – $0.0

GRT Short Term BullishOverall this crypto is very weak. Most alts are weak, with few exceptions. The Graph has actually been non-stop building even though the coin has bled out for 4+ years. I doubt the long-term trend is bullish, but on the short term, it looks like a standard head and shoulders pattern on the 1-hour.

GRT/USDT: The Graph's Phoenix Rising - A Technical Deep Dive🎯 The Trading Strategy : ⚠️ The Reality Check
Let's be honest - this trade isn't without risks...
Entry Strategy:
The Golden Support Zone : 0.05-0.055 (ALL TIME LOW levels)
⚡Target 1: $0.11
⚡Target 2: $0.13
⚡Target 3: midlle of 1W FVG
🔥 Risk/Reward: 4:1 🔥
_________________
Risk Management:
Stop

GRTJSE:GRT has formed a symmetrical triangle. Measuring the triangle’s range to its breakout gives a target around $15. This one is often called the Google of DeFi

GRTUSDTCryptocurrency Futures Market Disclaimer 🚨🚨🚨
Trading cryptocurrency futures involves high risks and is not suitable for all investors.
Cryptocurrency prices are highly volatile, which can lead to significant gains or losses in a short period.
Before engaging in crypto futures trading, consider you
GRTUSDT 1W AnalysisGRT ~ 1W Analysis
#GRT Buy back gradually from here with a short term target of at least 20%+ from this support.

The altcoin cycle is loading… don’t get caught chasing!Why It Might Be a Good Time to Start Building Your Nest Now 🥚🐣💸
If history’s taught us anything, it’s this: the best opportunities usually show up before everyone’s talking about them. 📈 Every cycle, whether it’s stocks, crypto, or real estate, rewards the people who start stacking early, not the o

Maintaining support is necessary, not essential, for the climb.Hello friends🙌
🔊Given the price drop, you can see that the support we identified has worked well for you so far and buyers have supported the price.
Now, given the heavy price drop and disappointment in the market, we can expect a rise until the targets are set.
Don't forget capital and risk mana
See all ideas
Summarizing what the indicators are suggesting.
Oscillators
Neutral
SellBuy
Strong sellStrong buy
Strong sellSellNeutralBuyStrong buy
Oscillators
Neutral
SellBuy
Strong sellStrong buy
Strong sellSellNeutralBuyStrong buy
Summary
Neutral
SellBuy
Strong sellStrong buy
Strong sellSellNeutralBuyStrong buy
Summary
Neutral
SellBuy
Strong sellStrong buy
Strong sellSellNeutralBuyStrong buy
Summary
Neutral
SellBuy
Strong sellStrong buy
Strong sellSellNeutralBuyStrong buy
Moving Averages
Neutral
SellBuy
Strong sellStrong buy
Strong sellSellNeutralBuyStrong buy
Moving Averages
Neutral
SellBuy
Strong sellStrong buy
Strong sellSellNeutralBuyStrong buy
Displays a symbol's price movements over previous years to identify recurring trends.
Frequently Asked Questions
The current price of GRT / TetherUS (GRT) is 0.1022 USDT — it has risen 1.89% in the past 24 hours. Try placing this info into the context by checking out what coins are also gaining and losing at the moment and seeing GRT price chart.
GRT / TetherUS price has risen by 20.95% over the last week, its month performance shows a 20.95% increase, and as for the last year, GRT / TetherUS has decreased by −53.42%. See more dynamics on GRT price chart.
Keep track of coins' changes with our Crypto Coins Heatmap.
Keep track of coins' changes with our Crypto Coins Heatmap.
GRT / TetherUS (GRT) reached its highest price on Apr 21, 2022 — it amounted to 2.2400 USDT. Find more insights on the GRT price chart.
See the list of crypto gainers and choose what best fits your strategy.
See the list of crypto gainers and choose what best fits your strategy.
GRT / TetherUS (GRT) reached the lowest price of 0.0501 USDT on Nov 30, 2022. View more GRT / TetherUS dynamics on the price chart.
See the list of crypto losers to find unexpected opportunities.
See the list of crypto losers to find unexpected opportunities.
The safest choice when buying GRT is to go to a well-known crypto exchange. Some of the popular names are Binance, Coinbase, Kraken. But you'll have to find a reliable broker and create an account first. You can trade GRT right from TradingView charts — just choose a broker and connect to your account.
Crypto markets are famous for their volatility, so one should study all the available stats before adding crypto assets to their portfolio. Very often it's technical analysis that comes in handy. We prepared technical ratings for GRT / TetherUS (GRT): today its technical analysis shows the buy signal, and according to the 1 week rating GRT shows the neutral signal. And you'd better dig deeper and study 1 month rating too — it's sell. Find inspiration in GRT / TetherUS trading ideas and keep track of what's moving crypto markets with our crypto news feed.
GRT / TetherUS (GRT) is just as reliable as any other crypto asset — this corner of the world market is highly volatile. Today, for instance, GRT / TetherUS is estimated as 1.86% volatile. The only thing it means is that you must prepare and examine all available information before making a decision. And if you're not sure about GRT / TetherUS, you can find more inspiration in our curated watchlists.
You can discuss GRT / TetherUS (GRT) with other users in our public chats, Minds or in the comments to Ideas.