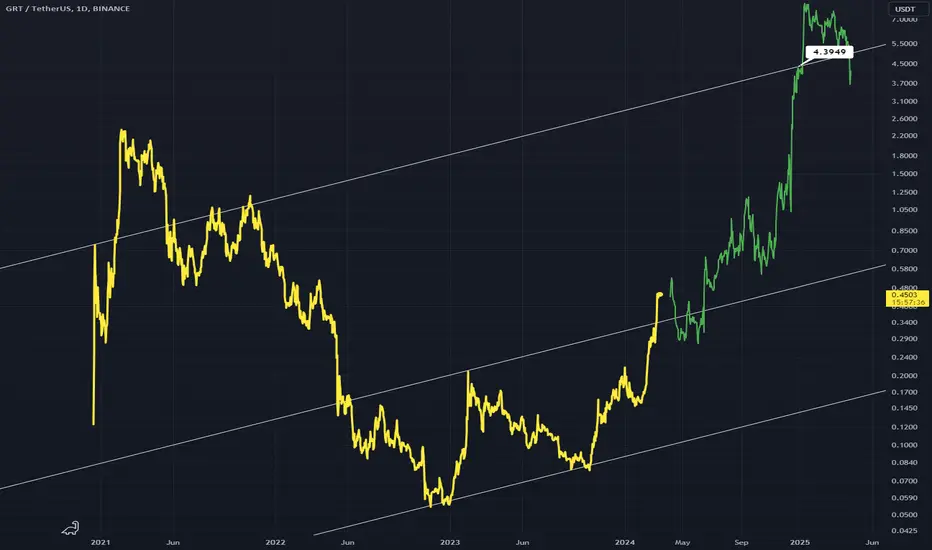
You might want to keep an eye on this GRTWhat are you up to GRT, as you can see the chart is simple and self explanatory,so watch it☺️🥱
GRTUSDT trade ideas

GRT QUICK EMREGENCY UPDATE 🐺Hello my friends 🐺 .
like the previous idea about the BOMEUSDT , I realized that many of you my dear friends like quick and short update , so i decided to publish idea in this way ;
as you can see in the 4H time frame there is a very clear bull flag in the chart which could goes us possibly to the blue box which is also the previous high and the daily resistance area , in my opinion this current break out could gives us a very nice long trade in the way up around the 0.49$ .
don't forgot to follow me for the next updates 🐺 .
Have nice trade my friends 🐺

GRT On Fire: Don't Miss Out on This Buy Trade!The Graph (GRT) - Fundamentals and Recent News (as of March 28, 2024)
In a nutshell:
GRT is the token that powers The Graph, a decentralized project for organizing and accessing data from blockchains.
Think of it as a search engine for blockchain data, similar to how Google indexes the web.
GRT is used to incentivize participants who maintain the network (indexers, curators, delegators) by rewarding them for their work.
Recent news:
There haven't been any major news headlines about The Graph recently, but the project continues to develop and process blockchain data.
Important to note:
This is not financial advice. Do your own research before making any investment decisions.
The cryptocurrency market is volatile, and GRT's price can fluctuate significantly.
Further resources:
You can find more information about The Graph on their website:
You can check the current price and performance of GRT on cryptocurrency tracking websites like CoinMarketCap or CoinGecko.

GRUSDT BUY IDEAWhile technical analysis provides valuable insights into market trends and patterns, it's essential to pair it with effective risk management strategies. By setting appropriate stop-loss orders, managing position sizes, and adhering to sound risk management principles, traders can mitigate potential losses and safeguard their capital. Mastering the art of trend and wave analysis equips traders with the tools they need to thrive in the dynamic world of cryptocurrency trading, paving the way for success in assets like GRT/USDT

GRTUSDTGRTUSDT is in strong bullish trend.
As the market is consistently printing new HHs and HLs.
currently the market is retracing a bit after last HH, which is 50% Fib retracement level and local support as well. if the market successfully sustain this bullish confluence the next leg high could go for new HH.
What you guys think of this idea?

GRTUSDT Continues the journeyThe AI category is showing a strong trend in this year. If GRT can keep up this trend, it will be able to make a nice run.
A breakout from the downward trend is possible. Price support is in place, let's see how strong the bulls are.
DYOR

GRT can 10x in a few weeks! Best time to buy now?Technical analysis
GRT looks extremely good on the weekly chart. We can see that the downtrend ended on a breakout of the red trendline, and since then, the price has been going upward. I believe this coin will 10x in 2024 if you buy it at the current price. We should hit an all-time high in 2024, and in 2025, this coin will continue in the price discovery! Put a stop-loss below my support zone!
Let me know what you think about my analysis, and please hit boost and follow for more ideas. Trading is not hard if you have a good coach! Thank you, and I wish you successful trades.
What Makes The Graph coin Unique?
The Graph is working to bring reliable decentralized public infrastructure to the mainstream market. To ensure economic security of The Graph Network and the integrity of data being queried, participants use Graph Token (GRT). GRT is a work token that is locked-up by Indexers, Curators and Delegators in order to provide indexing and curating services to the network.
GRT will be an ERC-20 token on the Ethereum blockchain, used to allocate resources in the network. Active Indexers, Curators and Delegators can earn income from the network proportional to the amount of work they perform and their GRT stake. Indexers earn indexing rewards (new issuance) and query fees, while Curators earn a portion of query fees for the subgraphs they signal on. Delegators earn a portion of income earned by the Indexer they delegate to.
Let me know what you think about my analysis, and please hit boost and follow for more ideas. Trading is not hard if you have a good coach! Thank you, and I wish you successful trades.

GRT/USDT upward momentum what next? 🚀GRT Analysis💎 Paradisers, turn your attention to #GRTUSDT! We're witnessing potential signals of a bullish turnaround from the crucial support point at $0.3535. Maintaining strength at this juncture could foreshadow a significant move ahead. It's noteworthy that #GRT is currently following a descending trendline, which, if broken in favor of an upward movement, sets sights on the initial resistance target at $0.5027.
💎 Should the price struggle to sustain its stance at this critical support, we may need to explore alternative scenarios. Anticipating a bullish resurgence from the Fair Value Gap (FVG) level or eyeing the lower support at $0.2667 becomes crucial, especially since the market has already probed liquidity beneath this level.
💎 Proceed with caution: slipping past this secondary line of defense might spell a move into deeper bearish territory, underscored by intensified selling activity. It's imperative to remain alert and flexible as we navigate the evolving dynamics of the #GRT market.

GRT/USDThi this is GRT/USDT 15m timeframe
two poosible directions based on drawings
this positione will expire after few hours
...
.....
......
....

GRT TO THE MOON ?well as you can see GRT is in the bullish flag and can go up as its flag height which is equal to 113 percent or 89 cents. #DYOR #NFA

GRT will go very crazyGRT will bounce up like crazy to the moon 🌙
We holding very strong support zone
Be ready for the 🚀

GRTUSDT upwards targets in fib extension+resistance fan putting fib extension levels over a larger fib speed resistance fan. daily TF log.
Next few days GRT will break out of current channel even just laying still sideways. Pressure is on the bears to keep it to the lower half of the current channel. If sellers can't produce strong enough dumps, GRT shoots out the channel to the ceiling of the channel above which is above $0.30 for the next 2 months. fib extension level 1 = $0.285. So about 200% gain from the current price. That's the most conservative estimation.
It could happen much faster too. Then we would be looking at sub $0,60 price range. That's 400% gain.

GRT USDTGRT Setup. Entry after confirming breakout from trendline Remember always use stop loss
Everything is on the chart
Entry 0.4264
S.L 0.4052
T.P1 0.4587
T.P2 0.4918

GRT: sell high channel📊Analysis by AhmadArz:
🔍Entry: 0.442
🛑Stop Loss: 0.459
🎯Take Profit: 0.427 -0.410 -0.398
🔗"Uncover new opportunities in the world of cryptocurrencies with AhmadArz.
💡Join us on TradingView and expand your investment knowledge with our five years of experience in financial markets."
🚀Please boost and💬 comment to share your thoughts with us!

grtusdtBitcoin's protocol to control its inflation rate. The most recent halving occurred in May 2020, reducing the block reward from 12.5 to 6.25 bitcoins per block. The next halving is expected around 2024. It often leads to increased attention from investors and can affect the supply and demand dynamics of Bitcoin, potentially influencing its price.

GRTUSD - W Structure Bull RunSuggesting a bull run to continue from this run and complete a large W formation
Bullish charting speculation
AI coins are a good idea to be looking into
GRTUSDTGrt web 3 cion very strong pair
GRT" is the ticker symbol for the cryptocurrency "The Graph." It is a decentralized protocol for indexing and querying data from blockchain networks, making it easier for developers to access and retrieve blockchain data in a decentralized manner. The "USDT" part refers to Tether, a stablecoin pegged to the value of the US dollar. Combining them, "GRTUSDT" likely indicates a trading pair where GRT is traded against USDT on various cryptocurrency exchanges

GRT Price Update#GRT price update. After a successful breakout from a level marked at 0.3434, we will see massive gains. We could take entry after 4 hours candle close above the marked level. The entry point is at 0.3508. Always use stop-loss. Everything is on the chart.

GRT/USDT, Bullish trend in Paint!Prior published chart was based on worst case scenario of possible corrective rise which still could be the case but due to recent PA and market behaviour, I thought to publish this Bullish case scenario. How ever for new comers try to build a position with addition on pullbacks.
time frame which we expect highs get hit Max by end of this year going into next year.
Good Luck

#GRT can touch 0.46 .Hold this on Spot#GRT can touch 0.46 .Hold this on Spot..
GRT have volume of bulls. It'll take time but it may reach at 0.46,before making new low.

the graphito yeahguys.. im still thinking this coin could reach 2$.
idea: market movement, going up
resistance line crossed next 2nd elliot wave leg forming.

GRT (The Graph): Powering the Decentralized Data Ecosystem📈 GRT (The Graph): Powering the Decentralized Data Ecosystem with Innovation! 📈
Hello Crypto Community! 👋 The FXProfessor here, unraveling the vibrant narrative of GRT (The Graph). Let's explore how this trailblazing token is carving its niche in the decentralized data exchange sector.
GRT's Market Performance:
💥 Recently, GRT joined the AI token surge with a significant 19% rise, demonstrating robust market dynamics amid a broader crypto rally (u.today).
🚀 Its price has soared by 20% in just seven days, reaching intraday highs of $0.154, a testament to its growing market confidence.
Innovative Roadmap:
🛠️ In one of its most significant updates, The Graph unveiled a roadmap to integrate AI-assisted querying with large language models, post a $50 million investment round in 2022 (u.today).
🌟 This roadmap sets the stage for enhanced functionality and broader adoption in the DeFi space.
The Graph's Core Solutions and Benefits:
🌐 As a pioneering decentralized indexing and querying software, The Graph has facilitated over a billion queries since its 2020 inception (securities.io).
🔍 It offers a cost-efficient and secure API, allowing decentralized applications to integrate data seamlessly onto the Ethereum blockchain (securities.io).
📊 The Graph's indexing capabilities extend across Ethereum, IPFS, and PoA networks, eliminating technical barriers to querying (securities.io).
Advanced Technology and Ecosystem:
🛰️ Utilizing GraphQL technology, The Graph provides detailed descriptions of data in each API, with over 2,300+ subgraphs deployed on the platform (securities.io).
💡 GRT, the main utility and governance token of The Graph, plays a crucial role in the network with a max supply of 10 billion GRT coins (securities.io).
🗳️ The Graph Council and the upcoming shift to a decentralized governance model underscore the platform's commitment to community-driven development (securities.io).
💰 The Graph Foundation promotes adoption and innovation, funding new projects using Graph, with grants derived from 1% of network fees (securities.io).
Unique Features of The Graph:
🏦 GRT users can stake their tokens for passive rewards, contributing to the platform's health and efficiency (securities.io).
👥 Indexer nodes maintain the platform's indexing function, while Fishermen nodes verify the accuracy of query responses (securities.io).
🌟 Graph's critical role in the market is expected to continue as it fuels innovation and development in the decentralized sector (securities.io).
FXProfessor's Analysis:
🌐 GRT represents a significant leap in decentralized data exchange, providing invaluable services and driving innovation in the blockchain and DeFi sectors.
🔄 Stay updated as we follow GRT's exciting journey, a cornerstone technology shaping the future of decentralized data exchange.
Trade wisely, stay informed, and let's embrace the innovations brought by GRT in the crypto world! 💙
One Love,
The FXProfessor 💙
Links (securities.io) :
u.today
www.securities.io

GRTUSDTBINANCE:GRTUSDT is attempting a retest of the 0.16242 area. Are we going to see a rejection of the zone for a continuation of the bullish move or are we going to see a further push to the lower side? Either way, #GRTUSDT will tell us its next move. Until then, fingers crossed
Updates on this will follow...
