GRT Long Update: Tagged $0.14Previous (conservative) long target has been far exceeded over the past few days.
Price now tapping the trendline going back to Feb '21 (blue line), which makes this a decent place to sell for the time being before possibly planning to push much higher. Personally taking a break from GRT and looking toward smaller cap projects now.
Let me know if you took this trade and rode it out to the current high. Good luck!
GRTUSDT trade ideas

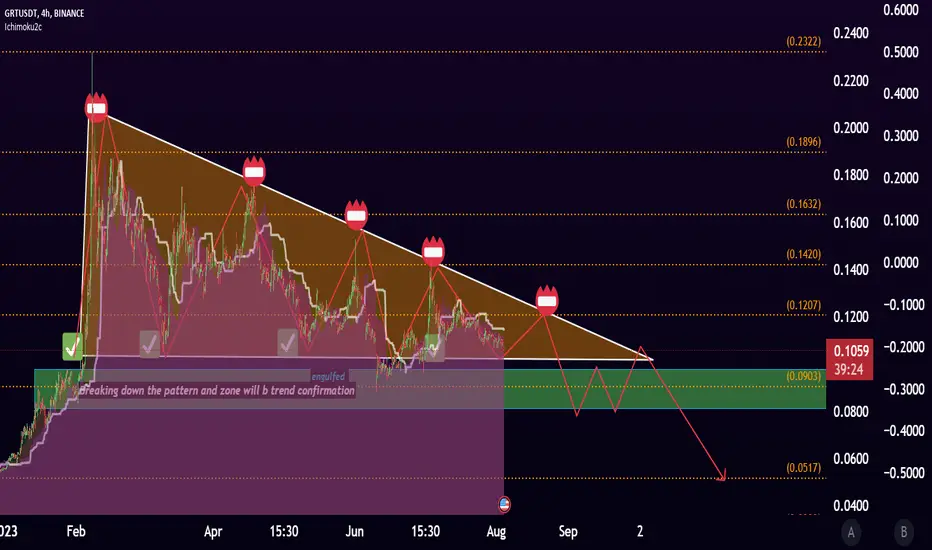
GRT/USDTJSE:GRT has had no chill lately, just keeps pumping, do you think it will break out from the multi year diagonal resistance line and hit $0.32?

GRT (The Graph)----->Long (30X)Hello to all crypto players
If you like to risk a small part of your portfolio, but you are not interested in meme coins, then pay attention to this BINANCE:GRTUSDT !
The Graph is an indexing protocol for querying data for networks like Ethereum and IPFS, powering many applications in both DeFi and the broader Web3 ecosystem. Anyone can build and publish open APIs, called subgraphs, that applications can query using GraphQL to retrieve blockchain data. There is a hosted service in production that makes it easy for developers to get started building on The Graph and the decentralized network will be launching later this year. The Graph currently supports indexing data from Ethereum, IPFS and POA, with more networks coming soon.
Market cap
9.04%
$1,187,268,975
#46
Volume (24h)
31.61%
$127,555,041
#44
Volume/Market cap (24h)
10.74%
Circulating supply
9,281,136,914 GRT
Total supply
10,777,673,677 GRT
Max. supply
∞
Fully diluted market cap
$1,378,602,800
My view:
A token from the artificial intelligence category with excellent fundamentals and technicals and almost Circulating supply 100% and a drop of 95% from the ATH.
But don't rush to enter because to confirm the start of the main bullish rally:
We need to break the yellow line with strength and momentum and stabilize the price above that area.
My setup:
Entry after yellow line breakout
(0.17$)
TP In order of time frame and probability
0.72$
1.13$
1.7$
2.8$
.
.
.
4.7$ very imaginative goal
7.4$ very imaginative goal

#GRT Wait For ConfirmationKeep an eye on it, if the resistance of 13.43 is not broken and it is confirmed below the range, you can enter into a sell transaction.

Bulltrend on GRT TokenI know that we do not have an interesting economic situation
But it seems that GRT digital currency is ready for a powerful growth.

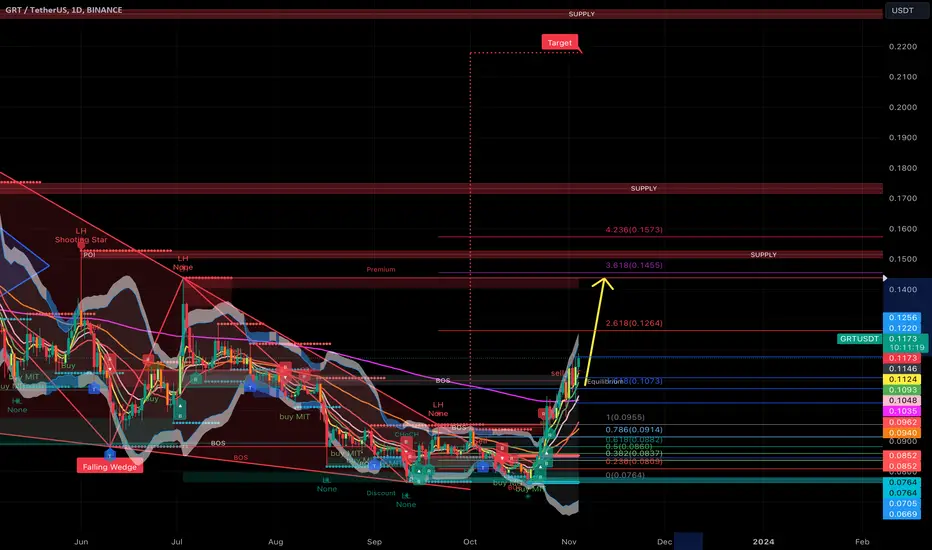
GRT - 1D Short 20% increase possibleGRT is in a bullush trend up to Fibonacci level 3.618. With the announcement upcoming next week GRT can do another 30% when there is really good news.
Factors for growth on the GRT chartHello everyone!
The asset has broken through the descending trendline, and within the same range, the EMA 200 moving average has also been breached. Following this, the asset retraced to this area and continued its upward movement.
Currently, the asset is attempting to establish itself above the 0.236 Fibonacci level, and if successful, further upside movement towards the 0.618 Fibonacci level can be expected, which represents a 50% increase from the current price.
On the chart, resistance zones around $0.13 and $0.15 have also been marked.
This is not financial advice, and everything you do is at your own risk.

GRT/USDTJSE:GRT W pattern (double bottom) has been confirmed and measured target is showing that it still has legs to pump, $0.32 is next resistance if the W pattern plays out.
GL

GRT reclaim imminentGRT consolidating for about 20 days now in a previously quickly bought-up region between 0.0875 and 0.0975, especially back in June - July 2022 (not shown on chart; if I knew how to do two slides I would show it).
Would be pleased with a 30% max, but 10% much more likely for at least now, reclaiming out of the demand area.

grtConsidering that the resistance line has broken, I expect a correction, and move towards the upper box. Then correction to the lower green lines.

#GRTUSDT #LQR #TOBTC #LaqiraProtocolThe price has reached the current resistance after a strong breakout of the 0.0940 & 0.0960 resistance. You can look for a sell position after confirmation based on your strategy in this area. This is a personal view and the offer is not to buy or sell.

🔥 GRT Falling Wedge Break Out: Start Of Huge Move?Great news for GRT holders; the token has finally broken through a bearish resistance line that has been keeping the price in check since early 2021.
In my view, this can be the break out that bulls have been waiting for, making the 0.06$ area the definitive lows of the bear market.
Target placed at the November 2021 top.

Graph in potential 50%pump🙂👍Personal idea: Based on the graph previous movements, 0.1 is one of the key levels, in the case of finding support in this zone, it can go towards previous high around 0.15. Good 🙂 luck 👍

GRT target 0.251D time frame
-
GRT is breaking out the falling wedge structure, but this downtrend line is not standard due to many wicks. On higher time frame like 4h or 1D, GRT gain demand at 0.08 which is also the structural support, and face the resistance from downtrend line, if GRT can break it out with high volume, we can set target based on the wedge.
TP: 0.25~0.25
SL: 0.0745

GRT Buying Frenzy: Seize the Opportunity Now.2nd**Short Fundamental**
GRT is the native token of the Graph Network, a decentralized indexing protocol for Web3 data. The Graph Network makes it easy for developers to build decentralized applications (dApps) that can access and query data from a variety of sources, including blockchains, APIs, and off-chain data stores.
**Recent News**
* **The Graph Foundation announced a $100 million ecosystem fund to support the growth of the Graph Network.** The fund will be used to invest in projects that are building dApps on the Graph Network, as well as to support the development of new tools and infrastructure for the network.
* **The Graph Network launched a new version of its indexing protocol, called Graph Protocol 3.** Graph Protocol 3 includes a number of new features and improvements, such as support for subgraphs, which makes it easier for developers to build and deploy dApps on the network.
* **The Graph Network announced a partnership with Chainlink to integrate Chainlink's decentralized oracle network into the Graph Network.** This integration will allow developers to build dApps on the Graph Network that can access and query data from real-world sources, such as financial markets and weather data.
**Disclaimer**
This is not financial advice. Please do your own research before investing in any cryptocurrency.

GRT/USDT 1DWe can see on the daily time frame trendline breakout and retest. GRT looks bullish and I expect the price action will go back to the POC level around the area 0,1107$

GRT 30% tradeBINANCE:GRTUSDT
Possible Targets and explanation idea
➡️Local 4h fib waiting test of 27 zone to open long
➡️Bitcoin Dominance can move to 51-55% and alts will drop
➡️Nonfarm not so positive for risky assets
➡️Target 0.618 and 0.786
Hope you enjoyed the content I created, You can support with your likes and comments this idea so more people can watch!
✅Disclaimer: Please be aware of the risks involved in trading. This idea was made for educational purposes only not for financial Investment Purposes.
---
• Look at my ideas about interesting altcoins in the related section down below ↓
• For more ideas please hit "Like" and "Follow"!

GRTUSDT_UPTRENDINGTECHNICAL OUTLOOK:
1. Printing HH and HL
2. No Divergence
TRADE PLAN:
I would recommend to go for Instant Buying. I took the entry at 0.382 level.

GRT super move after a long timeA very nice prints. Our next expected target is 0.11
DYOR
Contact me for resoruces.

GrtThe graph
Considered one of the best fundamental ai projects
Long term falling wedge..
77~% to the .618 of the falling wedge move
Breaking downtrend
Looks to be building a support to bounce off...
Way down from hypecycle valuation as with most projects..

The grt currency is a buy signalHe came back well in support and now we have to hope for the defeat of the resistance
There is a block order at 0.1 and I expect it to go towards this block order
A liquidity and selling whale is also at the price of 0.085, which can delay the growth of the pump a bit.
But it can become a full target in one month


GRT USDT By HesamUNThey traders
everything we need is in the chart
what u think about GRT ?
share ur chart and leave a comment
( its for u sami )