GRT/USDT possible scenarios what next? 👀 GRT Today Analysis💎 Paradisers, let's delve into GRTUSDT! It’s navigating between robust resistance and support, presenting two potential outcomes.
💎 Upon scrutinizing GRT, we’ve observed that it has recently encountered the daily resistance level, establishing a downward path. In this scenario, if the price surpasses 0.0902—indicating a recent low break a minor pullback is likely before initiating a continued downward journey to retest daily support.
💎 Alternatively, should it sustain its momentum and the buyers gain the upper hand over sellers, we hold a positive outlook that it will embark on a bullish continuation from the 0.0920 level. In either scenario, if you are contemplating a trade, employ an appropriate stop loss and trade judiciously.
💎 Remember to employ prudent trading strategies and use proper stop-loss measures! Stay alert to market movements and look forward to more insights!
GRTUSDT trade ideas

Above 0.0872-0.0893: Short-term upward trend reversalHello?
Hello traders!
If you "Follow" us, you can always get new information quickly.
Please also click “Boost”.
Have a good day.
-------------------------------------
(GRTUSDT chart)
The key is whether it can rise above 0.1453.
(1W chart)
To do so, it is necessary to check whether the price can be maintained and rise above 0.0851.
(1D chart)
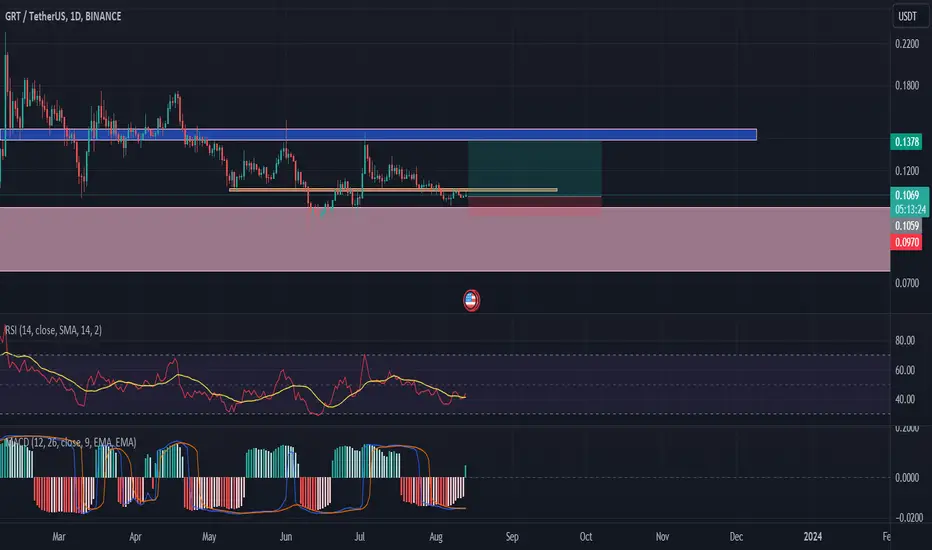
The key is whether the price can be maintained above 0.0872 and rise above the HA-High indicator.
Accordingly, we need to check whether it can receive support around 0.0872-0.0893 and rise to the 0.0970-0.1084 range.
Otherwise, if the HA-Low indicator falls below 0.0834 and shows resistance, it is expected to lead to a further decline, so you should think about a response plan.
-------------------------------------------------- -------------------------------------------
** All explanations are for reference only and do not guarantee profit or loss in investment.
** Trading volume is displayed as a candle body based on 10EMA.
How to display (in order from darkest to darkest)
More than 3 times the trading volume of 10EMA > 2.5 times > 2.0 times > 1.25 times > Trading volume below 10EMA
** Even if you know other people’s know-how, it takes a considerable amount of time to make it your own.
** This chart was created using my know-how.
---------------------------------

GRTUSDT LONG/SHORT Just an IDEAGRT is in downtrend and accumulation and trending downwards since Weeks
There is two Scenarios that can happen at this moment
i have a strong feeling in BTC.D will allow Alts to pump Hard..
you may add GRT here ..
NAFA and plz DYOR.
Thank You...

GRTUSDT ShortGRT H1 chart, strong bearish setup. Supply zone was created by bears, Now they will try to retest demand zone around 0.08 level...

GRT veryyy soon :)After the corrections has made, can this experience an increase?
ready to fly ...:(

GRT/USDT Break Falling wedge, Bullish Momentum for The Graph💎 GRT has successfully broken out of its falling wedge pattern and the breakout has been confirmed. Currently, GRT is in the midst of an upward trajectory, having already completed its retesting phase and bounced off the support trendline.
💎 For further confirmation, it's crucial for GRT to break through the existing resistance area. If this occurs, it's likely that GRT will easily reach the bearish Order Block (OB) area or Target Price 2 (TP2). However, if the price faces rejection at the resistance and reverses, it may revisit the weekly OB area, providing an opportunity for additional accumulation.
💎 The bullish scenario would be invalidated if GRT's weekly candle closes below the weekly OB area.

GRT Buy TradeHere is My Study On GRT
Welcome to my channel! Here you'll find daily technical analysis ofthe latest trends in the crypto market. From Bitcoin to altcoins, I'lIl be sharing my insights and predictions to help you make informed decisions
about your investments. Follow me for the latest updates and join the conversation in the comments!
Crypto technical analysis uses past price history to predict future price. It's not a guarantee and shouldn't be relied on solely for investment decisions. Consider other factors such as market trends, economic strength and
information dissemination. Use with caution.
This Is Not A Finacial Advise

#GRT/USDT is bouncing from PWL support in 4-Hour TF!#GRT/USDT is bouncing from PWL support in 4-Hour TF!
JSE:GRT needs to clear the $0.08230 resistance level to gain bullish momentum. #GRT is holding $0.08 support level, breakdown below this level is bearish sign, and it can retest PDL.

GRT still looking bullish - Moon pending?GRT broke below our initial stoploss. If you followed the updates posted on the trade you would've seen that we did NOT in fact EXIT the trade at the SL and WE ARE STILL IN LONG. I've adjusted the SL since this and will update further.
The breakdown was weak and the 11c level has been tested three times since. We broke the downward trend line and have since confirmed it and looking to break the 11c mark. Once we do this we can look to be bullish for higher targets.

Check My Drawings on GRTBINANCE:GRTUSDT
Here i am looking for long GRT from this support
and i will hold till 0.1
lets check what will happened in upcoming days

Support Break and Potential DeclineFollowing a notable positive response when encountering support within the $0.10 range, the token GRT (Graph Protocol) managed to surpass a downward trend line resistance with the assistance of buying activity. After experiencing a slight retracement to approximately $0.105, its price momentum sustained, ultimately reaching $0.11. However, it's worth noting that the subsequent price drop and breach of the $0.10 support level can be attributed to insufficient demand despite an increase in trading volume during this interval.
Over a 4-hour time frame, the descending trend of GRT persisted, leading to a decline towards the $0.085 range. During this descent, a distinct channel pattern emerged within this support range. Nevertheless, it's important to acknowledge the potential vulnerability of this support level, as evidenced by strong selling pressure. Consequently, a breach of this support level might trigger a continuation of the price decline, potentially extending to the lower range of around $0.082.
Further down, GRT's support is contemplated to exist within the range of $0.071 to $0.074. This analysis highlights the intricate interplay between support levels, selling pressure, and price movements within the GRT market, providing insights into potential future price developments.

GRT ANALYSIS (4H)Hi, dear traders. how are you ? Today we have a viewpoint to SELL/SHORT the GRT symbol.
For risk management, please don't forget stop loss and capital management
When we reach the first target, save some profit and then change the stop to entry
Comment if you have any questions
Thank You

#GRTUSDT (Watchlist) 7-2023GRT is the native token of The Graph, a decentralized protocol for querying data from blockchains. It is an ERC-20 token on the Ethereum blockchain, and it is used to allocate resources in the network. Active Indexers, Curators and Delegators can earn income from the network proportional to the amount of work they perform and their GRT stake.
Total supply: 10 billion GRT
Circulating supply: 9.062 billion GRT
Max. supply: Not available
Market cap: $1.064 billion
Trading volume: 133.5 million GRT
Latest news
The Graph partners with Alchemy to simplify data access for developers. This partnership will make it easier for developers to access data from The Graph, and it will help to grow the ecosystem.
The Graph launches the Subgraph Studio, a tool for creating and managing subgraphs. This tool will make it easier for developers to create and manage subgraphs, which are the building blocks of The Graph.
The Graph announces the Graph Foundation, a non-profit organization that will support the development of The Graph. This foundation will help to ensure the long-term sustainability of The Graph.
Add BINANCE:GRTUSDT to your watchlist.
Note:
This isn't financial advice, but an analysis of coin movement (not a buy or sell signal). Before following any ideas, do your own research and practice good risk management.
You can't impose your opinion or force it to happen in the cryptocurrency market. So, be prepared for any outcome.
Remember, the cryptocurrency market is highly volatile and involves both gains and losses. Understand the risks before investing.
Good luck to everyone, and we hope that Allah reconciles and repays us all. 🙏

GRTUSDT 1D#GRT broken the Descending Triangle to the downside and retested it. So down we go! Targets are on the chart.

GRT/USDT longDirection: LONG📈
Reasoning: Showing strong reversal signs from the indicated support.
Entry: 0.084 - 0.093
OTE: 0.087
Targets:
Short Term: 0.0945 - 0.096 - 0.099 - 0.11 - 0.12
Mid Term: 0.13 - 0.15 - 0.17 - 0.20 - 0.23
STOP LOSS: 0.08151

GRTUSD: looking for a refillI like GRT and have been buying and selling; but, still have a small bag that I want to expand. GRT is doing things to become more decentralized and with AI tag on its brand, I think it should do well. But with anything in crypto world, you never know if a project will be successful or even a scam or not. So, I have waited for an attractive price point for a large purchase and looks like I might get it again. My first big purchase (over 5k at the rectangle area) earlier this year gave me almost 3x and I sold more than half. I want to put that back in again at the same area if it comes back to retest. Stop loss will be a bit loose below December low since I can afford to lose that much only. If I don't get it, then I will wait until I see a higher high above July high. Moves on GRT are very fast, so multiple limit orders are in the plan. Hopefully things will work out.

AltRun PITCH - N1 - GRTUSDT (3-5x)GRT prepared for bullish movement to 20s cent. If resistance breakout price rise to 1 dollar. Take position after breakout and retest in daily time-frame we are now in resistance area. Bullish divergence pattern Lower low spotted. DYOR

🚨 Trade Update: GRT/USDT (3-5x)🚨 Trade Update: GRT/USDT (3-5x)
📈 Long Entry: 0.0900 - 0.1015
OTE (Optimal Trade Entry): 0.0950
SL: 0.08691
B/E Move: When it moves close to TP2
TPs:
Short Term: 0.1030 - 0.1050 - 0.1080 - 0.1120 - 0.1180
Mid Term: 0.1250 - 0.1300 - 0.1350 - 0.1400 - 0.1440
**Disclaimer: Past profits do not guarantee future results.
Is there a risk? Of course. The whole financial market is subject to risk; any fundamental reason or sudden change in the market sentiment can reverse the current market dynamic and cause a loss. Do not take excessive risks which you cannot afford to lose. There is no obligation to take this trade; please avoid the trade if you disagree with the trade analysis.
EDK FORUM TRADING®

GRTUSDT is inside a falling wedgeFalling Wedge Formation: The market is currently forming a falling wedge pattern. This pattern is characterized by converging trendlines that slope downward. Falling wedges often indicate a potential reversal from a downtrend to an uptrend.
Testing the $0.12 Resistance: The current price action involves testing the $0.12 area as a resistance level. This level has historically played a significant role in the price movement of the asset.
Breakout Signal and Plancton's Rules: The anticipated action trigger is a breakout beyond the resistance level at $0.12. A breakout occurs when the price decisively surpasses a key resistance point, implying a potential shift in market sentiment from bearish to bullish. As per Plancton's Rules, this breakout could prompt a new long position.
New Long Position Opportunity: In accordance with the analysis and Plancton's Rules, a fresh long position might be considered if the price successfully breaks out above the $0.12 resistance level. A long position involves acquiring the asset with the expectation of its value ascending, aligned with the potential bullish momentum signaled by the breakout.

daily Bullish DO NOT FORGET USING A STOP LOSS
Warning:
This is just a suggestion and we do not guarantee profits. We advise you analyze the chart before opening any position.
I hope you are always profitable
GRTUSD ❕ double bottomTrading volumes are low.
The price has broken upwards through 50EMA (4H TF)
RSI is moving in the buying zone.
50EMA broke up through 100EMA (30m TF)
I think the chart will start to bounce on holding support.

GRT LONG - To the MOON?GRT presents a great structure on the daily with a break of the trendline and the formation of a clear head and shoulders.
First target: 14.6c
Second target: 17c
The weekly also shows a promising formation that if it plays out would bring GRT to 50CENTS.

The Graph /GRT/ moving through boring holidays. 1USDGRT moving through boring holidays.
GRT prepared for bullish movement to 23 cent. If resistance breakout price rise to 1 dollar. Take position after breakout and retest in daily time-frame we are now in resistance area. Bullish divergence pattern Lower low spotted. DYOR
