Is it time to buy?Hello friends✌
Given the good price growth and the arrival of buyers, now that the price is correcting, it is the best time to buy.
🙏If you like it, support it with a ✔like✔ and ✔comment✔.
*Trade safely with us*
GRTUSDT trade ideas
GRTUSDT 1D AnalysisGRT ~ 1D Analysis
#GRT Buy when re -testing this support block or buy after successfully penetrating this resistant line with a short -term target of at least 10%+.

#GRT/USDT#GRT
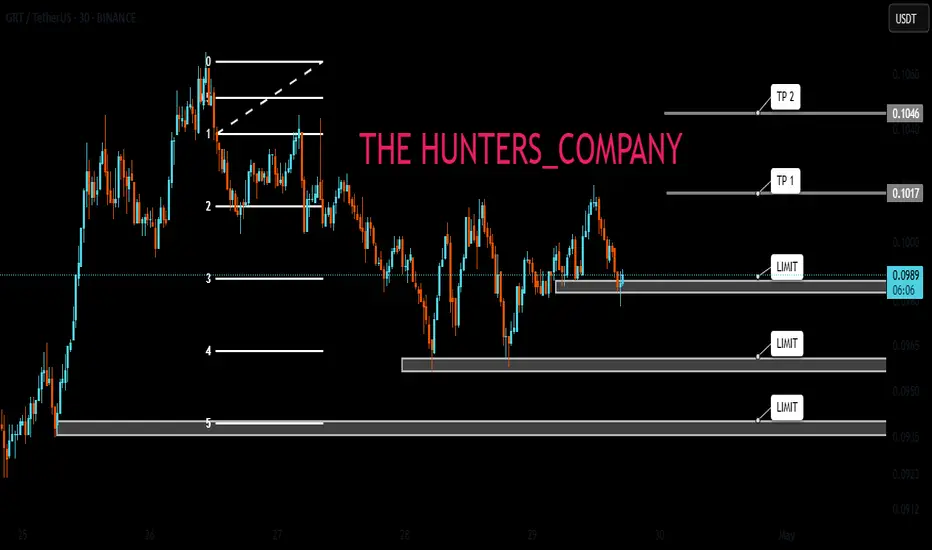
The price is moving within a descending channel on the 1-hour frame, adhering well to it, and is on its way to breaking it strongly upwards and retesting it.
We are seeing a bounce from the lower boundary of the descending channel, which is support at 0.0956.
We have a downtrend on the RSI indicator that is about to break and retest, supporting the upward trend.
We are looking for stability above the 100 moving average.
Entry price: 0.1010
First target: 0.1033
Second target: 0.1065
Third target: 0.1110

The Graph: Your Altcoin ChoiceCan The Graph really grow by 6,000% in 2025?
I don't know, seems like a lot but I also have some more conservative targets.
$2.04 can yield a huge 2,493% from current levels. This is GRTUSDT moving up and not hitting a new All-Time High in 2025. There is a long long-term higher low and higher lows tend to lead to higher highs, which means that an All-Time High is indeed possible.
Another conservative target sits at $1.18 for 1,400% from current levels. There are also several lower, short-term targets mapped on the chart.
The Graph peaked super early in 2021, in February. The rest of the market peaked in April, May and many pairs in November 2021. So this is almost erratic behavior. This is good for the long-term and for the 2025 bull market. When projects move in unique ways, it tends to be a positive.
The project has been solid and strong. The chart is also good with good price action, a nice design and reasonable growth. The action is happening now near the same levels as the September 2023 low support. From here, prices can grow.
It can take a few days, maximum several weeks for the start of the next bullish wave. May for certain but never beyond. In fact, the bottom might be in now and we are gearing up for up for months.
I will not give you more as this is enough... A full bull market can develop within 6 months. Sometimes it can take 12 months or 16 months, but at other times, a pair can produce all the action in less than 6 months. This might be one of those.
Be prepared.
Thank you for reading.
Feel free to leave a comment with your questions.
If you enjoy the content just follow.
Namaste.

The Graph drop to 0.055C Then Rally to 0.27C?Hello traders as we can see the graph looks like it may be falling and testing the ultimate lows what I have named the last line of defence which is around 0.05C. Great buying opportunity where I will be loading my bags. From here an obvious take profit is that prevailing green trend line suppressing the line around 0.27C
Entry 0.05C
TP1 0.1
TP2 0.2
TP3 0.3
NFA


THE GRAPH LOWER BEFORE HIGHER?Hello traders as we can see the graph is trying to break out but is struggling. I believe a ST of that yearly low 0.0796 is about to take place. Before pushing higher the graph needs liquidity from lower prices If broken cheaper prices are on the horizon such as
0.0765
0.0732
0.6
and even 0.0520 C
If this happens I will be loading my bags! NFA

bearish market GRT is showing readiness to touch lower prices. I suggest standing by for long positions in autumn.
GRAPH MAKE IT OR BREAK ITHello traders as we can see the GRAPH is in a continuous downtrend. I believe it will come and test the yearly low or even put in a new low

Trading Idea for GRT/USDT Based on the ChartChart Analysis:
Head and Shoulders Pattern – A classic reversal pattern is identified, indicating a potential decline after forming the right shoulder.
Descending Channel – The price is moving within a downtrend, marked by two blue lines. A further drop to the lower boundary (~$0.025–$0.030) is expected.
Elliott Wave Analysis – After completing the 5th wave of the downward cycle, a bullish impulse wave is anticipated.
Potential Upside – Following the expected decline, a breakout from the descending channel could lead to a strong rally, potentially reaching $8.00+.
Trading Strategy:
Short-term Strategy (Short Position):
Enter a short trade from the current levels ($0.096) or after a retest of the upper channel boundary ($0.12–$0.14).
Take profit targets: $0.05–$0.03.
Stop-loss: Above $0.15.
Long-term Strategy (Long Position):
Buy near the expected bottom zone at $0.025–$0.035 (potential completion of wave 5).
Main targets: Take partial profit at $0.40–$0.50, with an extended target of $2.50+ and beyond.
Stop-loss: Below $0.020.
Risks:
Possible false breakouts of the channel boundaries.
Prolonged consolidation before an upward breakout.
Market conditions (news, macroeconomic factors) may affect the expected scenario.
Conclusion:
A short-term short position can be considered, but in the long run, GRT has the potential for a strong rally once the downtrend cycle is completed.

GRTUSDT SCALP TRADE SETUP.GRTUSDT forming a clear long trade setup. As previous low liquidity has been swept and did BOS after taking previous low liquidity (MSS done). As MS done so we are expecting a internal liquidity sweep as FVG and then up as move marked,

GRT: Current SituationYou asked, and we delivered:
GRT is trading at 0.0930 USDT, down over 70% from its September peak of 0.3600 USDT, reflecting a steep decline amid a broader crypto market dip (total market cap down 4.4% in the last 24 hours). The price is testing a critical support zone at 0.0900-0.0930 USDT, with bearish signals dominating: it’s below the moving average, and indicators like MACD suggest ongoing selling pressure. A falling wedge pattern hints at a potential reversal, but volume is needed to confirm any breakout. The market’s cautious mood amplifies GRT’s struggles, making this a pivotal moment.
Technical Indicators and Key Levels
Short-Term (4-Hour Chart):
Support: 0.0900-0.0930 USDT (critical), 0.0800 USDT
Resistance: 0.1000 USDT, 0.1200 USDT
Indicators: RSI near oversold (~30), MACD bearish. A hold above 0.0900 USDT could spark a bounce to 0.1000 USDT.
Long-Term (One-Year Chart):
Support: 0.0800 USDT, 0.0600 USDT
Resistance: 0.2000 USDT, 0.3000 USDT
Holding 0.0900 USDT is key for any recovery; below risks a deeper slide.
Potential Scenarios
Bullish Case: Hold 0.0900 USDT, break 0.1000 USDT with volume → target 0.1200 USDT (short-term), 0.2000 USDT (long-term).
Bearish Case: Break below 0.0900 USDT → test 0.0800 USDT or 0.0600 USDT.
Volume is critical—watch for spikes to confirm moves.
Broader Context and Tips
GRT’s role in decentralized indexing supports long-term value, but short-term risks loom. Traders should focus on 0.0900 USDT, a hold could signal a bounce, a break risks more downside. Use tight stops (e.g., below 0.0900 USDT for longs) and stay alert for volume shifts or news on adoption. Long-term, accumulating near 0.0900 USDT or 0.0800 USDT could pay off if the market turns.

grt mega bullishGRTUSDT is in its week OB+FVG area, Previously it also pumped from that area and expecting now as well. if it goes down lower time frame then do DCA.

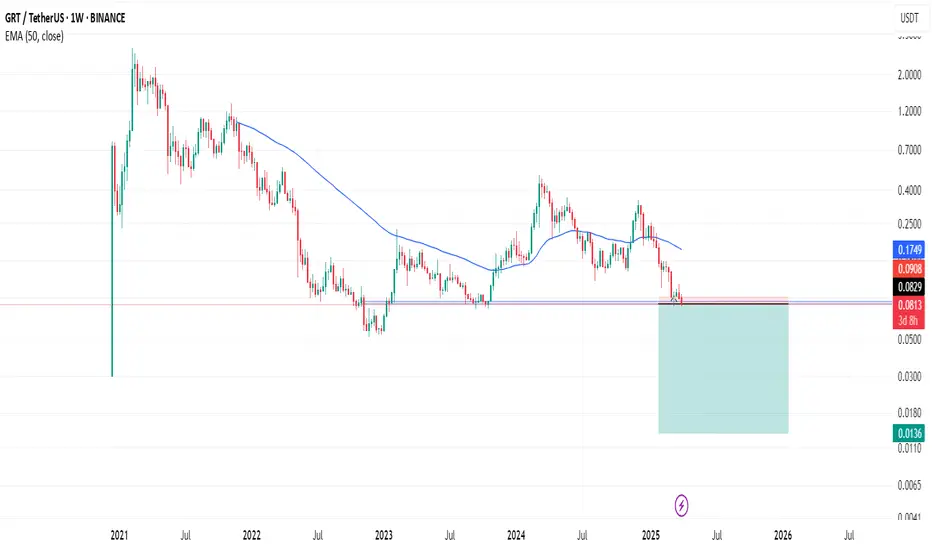
GRTUSDT 1WGRT ~ 1W Analysis
#GRT Buy gradually from here if you still have a Conviction on this Coin with a minimum target of 20%+.

GRTUSDT 1W🩸 JSE:GRT ⁀➷
#TheGraph. Macro chart Another
💯 Intermediate Target - $0.77
🚩 Macro Target 1 - $1.34
🚩 Macro Target 2 - $2.81
🚩 Macro Target 3 - $5.40
- Not financial advice, trade with caution.
#Crypto #TheGraph #GRT #Investment
✅ Stay updated on market news and developments that may influence the price of The Graph. Positive or negative news can significantly impact the cryptocurrency's value.
✅ Exercise patience and discipline when executing your trading plan. Avoid making impulsive decisions driven by emotions, and adhere to your strategy even during periods of market volatility.
✅ Remember that trading always involves risk, and there are no guarantees of profit. Conduct thorough research, analyze market conditions, and be prepared for various scenarios. Trade only with funds you can afford to lose and avoid excessive risk-taking.

This is a monthly timeframe chart of GRT/USDT (The Graph vs. TetThis is a monthly timeframe chart of GRT/USDT (The Graph vs. Tether). Let's analyze the situation:
1. Trend and Structure
Overall, the price is in a long-term downtrend after peaking in 2021.
There is a possible ascending triangle or accumulation zone, where the lower support line is gradually rising.
2. Support and Resistance Levels
Support: ~0.1047 (current zone), ~0.0805 (lower support).
Resistance: ~0.1170, ~0.1632, ~0.1748 (key levels the price needs to break for an uptrend).
3. Volume and Indicators
Volume is low, indicating a lack of strong buyer or seller activity.
Stochastic Oscillator is in the oversold zone, which could signal a potential upward reversal.
4. Possible Scenarios
Bullish Scenario: If the price holds above 0.1047 and breaks 0.1170 with volume confirmation, it could move towards 0.1632–0.1748.
Bearish Scenario: If 0.1047 is broken downward, the price could drop to 0.0805 or lower.
5. Conclusions and Strategy
If you want to enter, it's safer to wait for a confirmed breakout above 0.1170 with volume confirmation.
If 0.1047 support is broken downward, it’s better to look for buy opportunities near 0.0805.
For a long-term uptrend, the price needs to break at least 0.1748.
Depending on your trading style, you can consider entering near 0.1047 with a tight stop-loss or waiting for a confirmed breakout before entering a trade.

GRTUSDT long positionhi traders
GRTUSDT doesn't look bad here. The price is at the low-risk area for a swing long position.
Bullish divergences can be observed on 3D time frame.
2 targets are shown on the chart.
I can see it going higher than target 2 if you're patient but don't forget to take profit.

GRT Main trend. 23 02 2025Logarithm. Main trend. Time frame 1 week (no need for less). Hype will be when they promote everything related to artificial intelligence. It may go against the general trend in this regard.
But, at the moment, behind the market, which is logical. I imposed dynamic support/resistance zones of the Gann fan for orientation with the intersection of ordinary key levels (as everyone sees). I showed formations that can be formed and key reversal zones, percentages to them.
Previous closed trading idea +311% / +890%
1️⃣exactly in the designated zones of the planned first “hamster pump” +311%
2️⃣and the maximum pump (planned dump zone) 700-900%
GRT/USDT Main trend. Descending wedge. 8 02 2023
Local trading situation now.
Locally, after collecting long stop-loss at a large % (-27), this zone is held. If the market as a whole is positive, then this zone with 3 trend support points will be the main support for the development of the upward trend.
If this zone is broken, and the price consolidates below the “neck” level, then a decline to the 0.78 zone, that is, the formation of a descending wedge in the secondary trend. There will be a “double bottom” globally. Then, a breakthrough of the wedge resistance, and aggressive pumping under the hype of all that sort of thing.
Scam. Unlikely . Lower declines (implementation of "head and shoulders" without a squeeze) — the likelihood of a scam, that is, tales of hacking and "closure of the project". What is unlikely is how the project is traded in the US on Coinbase, and for this there are consequences for the creators.

The Graph (GRT)🔷 Introduction:
What is GRT?
The Graph (GRT) is a decentralized protocol designed for indexing and querying blockchain data. It enables developers to access blockchain information quickly and efficiently without the need to run dedicated servers. GRT serves as the native token of this ecosystem, used for transaction fees and securing the network.
🔹 Technical Analysis of GRT/USDT – Weekly Timeframe
📌 Overall Market Condition
After an extended corrective phase, GRT remains within its weekly ascending channel. The price is currently hovering around a key support zone (0.1165 - 0.1334, marked in blue), which has historically triggered significant reactions.
🔍 Potential Scenarios
📈 Bullish Scenario:
✅ If the blue support holds and the price re-enters the ascending channel, further upside potential is likely.
✅ Key resistance levels:
Orange Zone (0.3202 - 0.3577): Possible initial reaction level.
Red Zone (0.6423 - 0.7232): Major resistance before reaching the final target.
✅ Key Consideration: If weakness in momentum and declining volume appear near these resistance levels, gradual profit-taking and a cautious approach could be wise. Otherwise, continued bullish momentum could push the price toward the channel’s upper boundary, targeting 1.0667 - 1.2607 (light blue TP zone).
📉 Bearish Scenario:
❌ If the blue support fails, the price could drop towards the next major support zone at 0.0691 - 0.0816 (gray support).
❌ Losing this level would invalidate the bullish structure and increase the likelihood of deeper declines.
🎯 Entry Strategy & Risk Management
⚡ Gradual entry within the blue support zone with a stop-loss below the gray zone is recommended.
⚡ Suggested risk: 0.25% to 0.5% of spot capital (to prevent heavy losses).
⚡ Volume increase in this area could signal a potential trend reversal.
🔹 Conclusion
The current support level is critical for GRT. If it holds, the bullish scenario remains intact, allowing for potential growth toward the upper boundary of the ascending channel. However, losing this level could invalidate the bullish structure and lead to a deeper correction.
🔸 Additionally, when approaching key resistance levels (0.3202 - 0.3577 and 0.6423 - 0.7232), monitoring volume and price behavior is essential. Signs of weakness in these zones may indicate an opportunity for gradual profit-taking and a more cautious approach.

GRT Long Spot OpportunityMarket Context:
GRT has retraced to a key support zone and is presenting a potential bounce-back opportunity for a long position.
Trade Details:
Entry Zone: $0.125 - $0.14
Take Profit Targets:
$0.18 - $0.20
$0.2350 - $0.2550
Stop Loss: Just below $0.12
This setup offers a solid risk-to-reward ratio if the support holds. Watch for any price reaction at this level! 📈

GRT, WEEKLY LOOKThere are couple of counts here, either if this is a complex correction or start of an impulse (2 different impulse actually) GRT looks good.
We have swing vwap as a wall. If GRT gets over that vwap, things going to get better it looks.
It rejected from there couple of time so this is can be exhausting.
If BTC.D drops more and let alts print, that wall of worry will be breached i believe.

It is going very long term bullish from here Based on ICT analysis and SMC
SL AT 0.124
It ia on 4H D bullish FVG that moved the price to 5X in Nov

Trend lines! Bull run will continueI’ve made some previous calls for breakouts that were wrong. I think we were bullish too soon. We had a longer flush out period then everyone thought. This is good for the markets. Weak hands are selling and we are consolidating against trend pattern bottoms.
I’m more confident then I have been in the past few months that we will bounce off these support lines and rally to the 1 dollar mark in the next quarter.
Stay strong, DCA and have conviction in your investments
