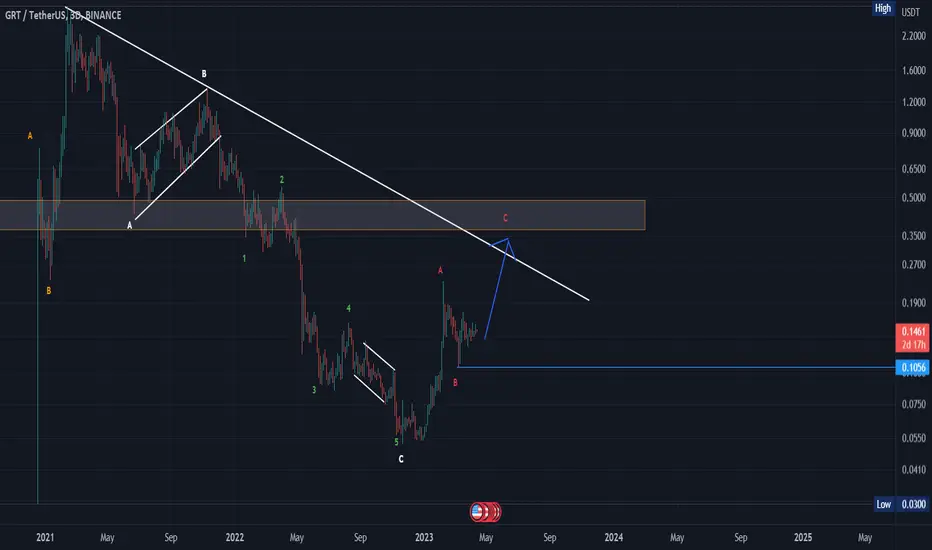
Complete the upward waveIt is possible to see the rise of a five-motive motive in the shaded area to close the C wave..
Note: The bullish pattern fails if it breaks the B area and closes below it at the B area 0.105 usdt
GRTUSDT trade ideas
GRTUSDTClearly whats going on.
They do their manipulation, liquidate orders and turn the price. Dont fall for it :)
BIG LONG, no questions asked.
NOT A FINANCIAL ADVICE :)

GRT CAN MAKE A CORRECTIONHi, dear traders. how are you ? Today we have a viewpoint to SELL/SHORT the GRT symbol.
For risk management, please don't forget stop loss and capital management
When we reach the first target, save some profit and then change the stop to entry
Comment if you have any questions
Thank You

future destinyThe structure that I see is clearly an ascending structure, you should also consider that it has been suffering for a long time and it is time to ascend.

Grtusdt Looking Good For Midterm Grt Preparing For Massive recovery In Coming weeks
Forming Descending channel In 2 days incase Of Breakout Expecting 300 to 320% bullish Move

GRTUSD: Potential Macro Descending Channel Break Hook and GoGRT has spent some weeks backtesting the supply line of this channel as support and may be preparing to soon continue it's ascent and potentially make a 0.618 Retrace which would take it to $0.62

good stop huntit is a good stop hunt and price come to this area whit cp pattern when we see rtiger we can get it

$GRT LONG , Lets GO! Only for weekend.Good volume, accumulation and possible rebound zone.
It is important to note that this trade is only valid for the weekend.

Artificial Intelligence Altcoins will explode imo$GRT $FET $OCEAN
AI narrative is picking up - 3 majors showing promise for the next bull cycle.
However, one seems to be lagging.
AI industry is about to explode and these alts with it imo.

GRTUSDTGRT has just been pump followed dump lately
Think the latest pump against the trend is similar
About to lose all 4 EMA's on the 4 hour Target 8-9cents

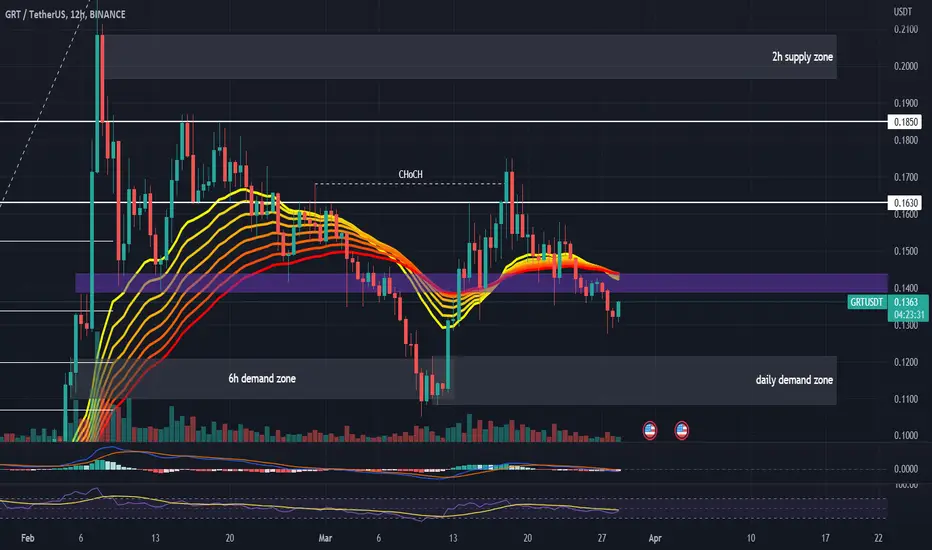
#GRTUSDT 12H Chart
Price is currently ranging in a descending channel creating lower lows and lower highs. MACD is showing bearish weakness, RSI and EMAs are neutral. I expect price to reach the major daily demand zone around $0.12 before expecting higher pricing from there.
Destiny oF 1hI did the USDT.D analysis, according to the USDT market cap analysis, I expect the market to grow

$GRT - Short Trade Set-Up$GRT - Short Trade Set-Up
Entry Conditions:
| Potential Bearish Cup & Handle
| Bearish Divergence
| RSI Trendline Breakdown

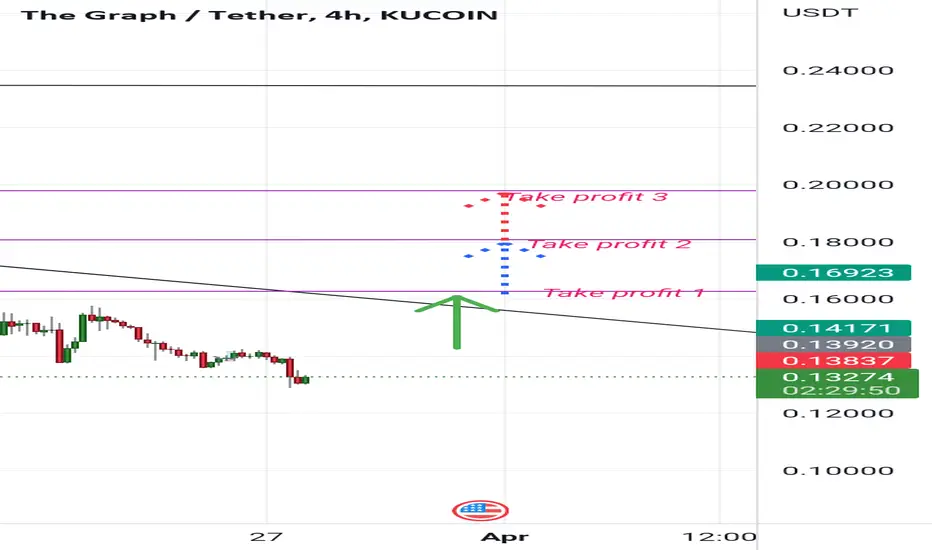
The Graph, possible movement Personal idea: The Graph is One of the my favorite altcoin and after 0.618 fib retracement and testing it's previous resistance and probably finding it's as support will be ready to continue it's bullish movement, I personally depicted 3 price of profit taking and totally is my personal prediction. All depends on overall positive market condition, Good 🙂 luck .
$GRT looks OK for a risky longTime to open a long in GRT
I think it shows signs of waiting for a small rebound.


GRT USDT Head & Shoulder Bearish PatternGRT USDT 1 Hr Chart Head & Shoulder Bearish Pattern Breakout done.
TP 0.13780, 0.13500

DestinyTwin bottoms are formed
Also, he has responded professionally to the second base and is very, very prone to growth


a good stop hunt it is LQ and the spike is clear white this movment in return to this area we can get aa buy position

GRT - Wyckoff AccumulationWyckoff Accumulation Pattern on 4 HR, Good possibility of strong uptrend once resistance levels are reached

GRT/USDTAfter the squeeze last week, GRT formed a LH and is starting to break down again on LTF.
Currently trading at MO and just above Mid Range, expecting Range Lows in due time.
Will a short after a break below MO and add to my shorts after it breaks below Mid Range.
This is a swing short for me and I will have 2 Targets as shown on the chart.
Follow, like the idea and feel free to leave a comment.
Check out other ideas if you like this one.
