GRT/USDTGRT losing steam and starting to show first signs of trend shift.
If it loses this support it will go down hard imo.
Currently trading at Mid Range, expecting Range Lows in due time.
This is a swing short for me and I will have 2 Targets as shown on the chart.
Follow, like the idea and feel free to leave a comment.
Check out other ideas if you like this one.
GRTUSDT trade ideas

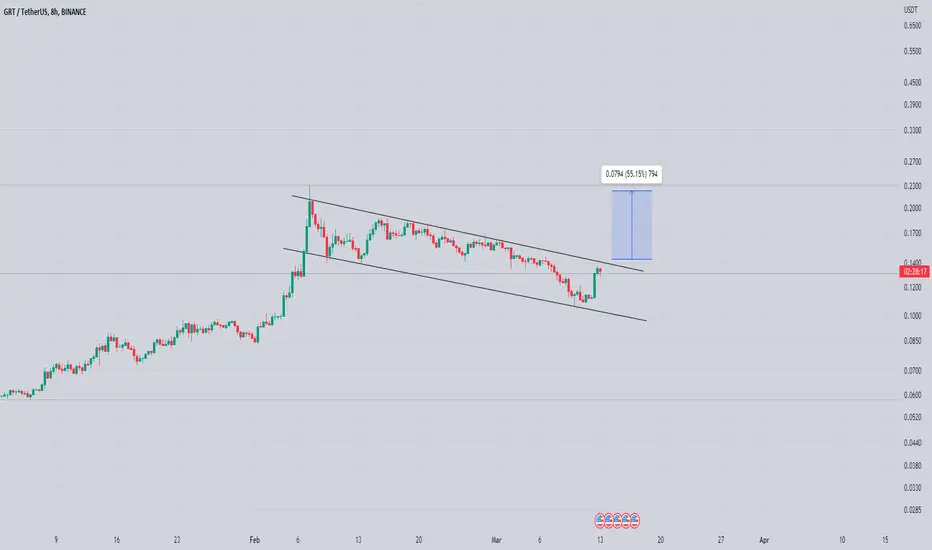
Grt Getting ready For Another breakout Building Up For Massive breakout
Formed Bullish Flag In h4 Timeframe incase of breakout expecting 35 to 40% Bullish Move
GRTUSDTHey traders, here is the analysi.
If you guys like my analysis please hit like👍 and follow.
Thanks.
DISCLAIMER- This is not financial advice.
SMART MONEY CONCEPT

GRT - Approaching A Demand 🔎 Analysis #7/50Hello TradingView Family / Fellow Traders. This is Richard, also known as theSignalyst.
As per my last analysis, GRT activated the wedge pattern and traded higher.
Last month, GRT rejected the 0.2 round number and traded lower. Now it is approaching a strong demand zone.
Moreover, the zone 0.09 - 0.1 is a strong support and round number.
🏹 So the highlighted blue circle is a strong area to look for buy setups as it is the intersection of the blue 0.1 round number and demand zone.
As per my trading style:
As GRT approaches the lower blue circle zone, I will be looking for bullish reversal setups (like a double bottom pattern, trendline break , and so on...)
📚 Always follow your trading plan regarding entry, risk management, and trade management.
Good luck!
All Strategies Are Good; If Managed Properly!
~Rich

GRTUSDT - Overbought on 3D timeframePosting for own future reference
RSI is "sell" zone
Price above BB
If today closes red (5.5h remaining), then idea is confirmed.
Same for 3D BTC pair:
Targets: 0.13, 0.11, 0.09 - 0.08. I really don't see it going any lower.
The indicators say "short" but minimize leverage, as this coin has proven to be highly volatile.

#GRTUSDT 6H Chart
Price is currently in a range showing no major movements. MACD is showing some bearish momentum, RSI is oversold and EMAs are bearish. I expect price to tap into the discounted 6h demand zone around $0.115 before potentially moving up again.

GRTUSDT Long Scalp SetupBasically, GRT is currently moving in a bearish channel,
As for now, Downtrend has not be broken, and signal bar has been seen.
Targets and SL are marked on chart,
Lets c

GRTUSDT- Pennant Continuation patterns Pennant Continuation patterns is Bullish This pattern exhibits a continuation of upward price movement.
Green Lines are TPS respectively.
My Entry: 1630

GRT: But the dipHello Traders!
Welcome back to another trade with analyst Aadil1000x.
Today we are also going to BUY GRT because there is a rising wedge pattern and it is a bullish pattern. We are aiming for at least 3.3% profit in this bull run.
GRT 0.1422 Buy Limit
Stoploss 0.1395(-1.9%)
Target 1, 0.1469(+3.3%)
Final Target 0.1527(+7.38%)
Don't forget to hit the like button and follow to stay connected.

The Graph move following tomorrow news announcement.follow the rabbit! #GRT. falling wedge is a chart pattern formed by drawing two descending trend lines , one representing highs and one representing lows.
It is categorized as a bullish reversal chart pattern.

GRT descending wedge pattern#GRT. falling wedge is a chart pattern formed by drawing two descending trend lines, one representing highs and one representing lows.
It is categorized as a bullish reversal chart pattern.

GRT two waysWhat's more likely? I believe these are two scenario's we need to be looking at in the coming days.

GRT Short term chartSharing a chart for GRT . Had a nice run up with the AI hype in crypto. Now forming a descending triangle. A lot of gaps to be filled.


GRT Trade set upWatching the 200 MA as support zone.
Entry here and lower.
Bullish case: Bounce in between current price in .1627
Target: .18688
Bearish: Bearish Retest of 200 MA and .1627
Target: .1431

GRTUSDTThe targets are close and they are now in the price equilibrium areas, and do not forget to place the stop loss

Massive potential for a long term pumpGood opportunity to buy The Graph here for the long term.
Current Market Cap: 1.4B USD
Target: ATH+

GRT longAs you can see on the chart, GRT has broken the triangle and it's pullback is completed, I go long...


fib time zone real or load of crabs?BINANCE:GRTUSDT
fib time zone real or load of crabs? find out next monday feb 27 00:00 UTC-8!

grtusdtsolid structure 4h
double bottom, at least where to run away is clear
must give a chance to this trade

🔥 GRT Bearish Triangle: Patience!GRT has seen a massive move over the last weeks, but it's showing some weakness recently.
I'm waiting for the price to break through the bottom yellow support area. A break out here can cause a further fall towards the blue targets.

GRTUSDT ..... LONG/SHORTGRT IF GOES DOWN FROM THE CURRENT SUPPORT ZONE
then the new entry zone is around the buy zone as highlighted at chart
else if it breakout then a retest with good volume can pump GRT back to .21 and above area....
Wait for confirmation for a breakdown/ breakout
never a financial advi..
its just a small idea
DO UR RESEACH
