$grt looks fundamentally ready to move upall 3 local lows have caught support on the daily 200sma, price is consolidating inside a falling wedge with good volume, rsi is confirming a breakout with multiple test/finding support of its own trendline. need to overtake the other ma's and top trendline of the wedge, if this occurs short term target would be around .30-.35
GRTUSDT trade ideas

$GRT Spot Buy Setup!JSE:GRT Spot Buy Setup!
📍 Entry: Now
🤔 Why?
- Double Bottom on the 4hr
- RSI Divergence
💰 Targets:
🎯 1) 0.1964
🎯 2) 0.2025
🎯 3) 0.2083
❌ Stop Loss: Close 4hr candle below 0.1796
✅ This is not financial advice; it is just an analysis.

GRT LONG GRT seems to be heading toward the nPOC, considering that the USDT.D chart is also in a support zone, increasing the chances of GRT reaching 0.14. Interestingly, the stochastic RSI also attempted a positive cross but was rejected. Moreover, the price forms a descending triangle. These combined factors make me think there's a 60–70% chance we'll see GRT at a lower price soon.

GRTUSDT 1WGRT ~ 1W Analysis
#GRT If you still have Conviction on this coin, this is a very good support block for now. buy from here with a minimum target of 20%+

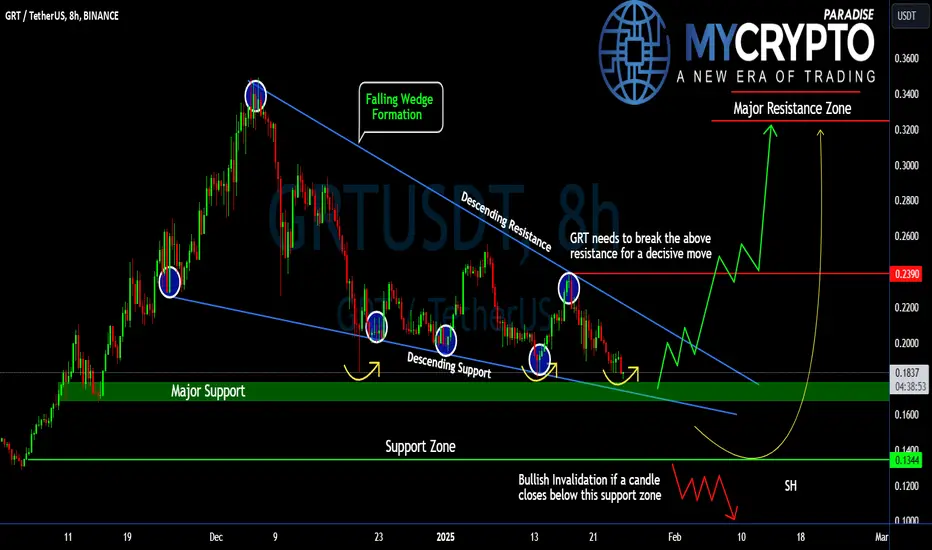
Will #GRT Finally Break Free From Its Falling Wedge? Key LevelsYello, Paradisers! Are we about to witness a bullish breakout for #GRTUSDT, or could this falling wedge formation drag the price further down? Let's look at the latest setup of #TheGraph:
💎#GRT is currently trading within a falling wedge pattern along with a triple bottom pattern established in an 8-hour timeframe chart and showing a high probability of a bullish reversal from its current trajectory. However, patience is key as a breakout confirmation is essential before taking any decisive action.
💎#GRTUSD is approaching a critical resistance zone near $0.239, which aligns with the upper boundary of the wedge. A breakout above this level would signal bullish momentum and could pave the way for a sharp rally toward the $0.32–$0.33 zone, where sellers are likely to step in.
💎On the downside, $0.17 has been acting as a solid support zone, with buyers stepping in to defend this level each time the price approaches it. As long as this support is in place, the bullish scenario will remain valid. However, if this support fails then the asset will fall to the $0.134 support zone where buyers are expected to step in.
💎However, if the price closes below $0.134, the bullish setup would be invalidated, and the price could slide toward $0.12 or even retest the $0.10 zone, where further demand is expected.
Stay focused, patient, and disciplined, Paradisers🥂
MyCryptoParadise
iFeel the success🌴
GRT at crucial supportIf this support holds I expect that GRT will make a bounce back to the previous resistance and then break out and go onto the next resistance. If it doesn't hold I expect we will retest the lower trend line and then bounce back up. I do expect this level to hold as there is major bullish divergence on the rsi. GLTA, NFA! Will be looking for longs if we hold


GRT Long Spot Opportunity Market Context:
GRT is trading at a critical support level, signaling a potential bounce. This area offers a strong foundation for a long trade, supported by historical price action and favorable technical indicators.
Trade Details:
Entry Zone: $0.18 - $0.20
Take Profit Targets:
$0.2350 - $0.25
$0.29 - $0.31
$0.34 - $0.36
Stop Loss: Below $0.17
This trade presents an excellent risk-to-reward ratio, targeting gradual moves toward higher resistance zones. 📈

#GRT supports OB for long position.I'll try long if #GRT supports OB. 2.51% stop-loss, 10X for 25,1% gain.
#GRT LONG
ENTRY - 0.20559 - 0.19787
STOPLOSS - 0.19542
TP1 - 0.21596
TP2 - 0.23287
TP3 - 0.25666
TP4 - 0.27005
TP5 - 0.29388
R:R - 8.86

GRT looks bullish#GRT has a nice pattern for a good rise
there is triangle pattern as markets correction wave or wave 2 now we are going to make the 3rd wave so this should raise the market

The Graph (GRT): Preparing for Liftoff – Short-Term Breakout in📈 The Graph (GRT): Preparing for Liftoff 🚀 – Short-Term Breakout in Play!
Building on the big picture, GRT is showing signs of breaking out from its descending channel on the 1H chart, which could spark a move toward the next major targets. With critical support holding and bullish momentum building, it’s time to watch this sleeping giant closely.
Short-Term Key Levels to Watch:
Immediate Resistance: $0.2299 – A breakout above this level could ignite momentum toward higher targets.
Target Zone: $0.3197 – Short-term resistance that aligns with the broader setup.
Primary Target: $0.4093 – A retest of this level aligns with the bullish breakout narrative.
How It Connects to the Bigger Picture
In the big chart, we highlighted $1.0320 as the long-term target for GRT, based on its role as a Web3 indexing powerhouse and critical technical levels. This smaller move could serve as the first leg up in a larger bullish continuation.
Why GRT Could Wake Up Soon:
Descending Channel Breakout: A potential reversal pattern is forming, indicating a shift in sentiment.
Strong Fundamentals: As the “Google of Blockchain,” The Graph continues to power decentralized apps across Ethereum, Polygon, and Arbitrum.
AI + Data Narrative: GRT could capitalize on the growing interest in AI and data-driven crypto projects.
GRT is waking up, and it might not stay quiet for long. Keep an eye on the short-term breakout above $0.2299 and the rally to $0.4093 and beyond. Are you bullish on GRT? Share your thoughts below! 👇
One Love,
The FXPROFESSOR 💙

GRT looks bullish (3D)From the point where we placed the yellow line on the chart, it seems that GRT has started forming a diametric pattern.
Currently, it appears we are at the end of wave D. In any case, as long as the green zone is maintained, it is poised for growth.
The target could be the red box.
The closure of a daily candle below the invalidation level will invalidate this analysis.
For risk management, please don't forget stop loss and capital management
Comment if you have any questions
Thank You

GRT Bullish Mode 2xGRT has iHnS pattern, BIG iHnS yes BIG because it on 1D timeframe
current price is on 0.2 and if it not break support below 0.17-0.16 iHnS will valid and we will see price around 0.5

1D:GRT- POTENTIAL SETUP. GRT ALWAYS FOLLOWS TECHNICALS!GRT Potential Long Setup-\
FYI- This is technically not a valid harmonic pattern, however it is within reasonable parameters, BUT...
IF you seen my last GRT setup, you would know what GRT can do these similar conditions. GRT has reached the .86 retrace from last swing high/low and corrected accordingly. Now we yet again a similar structure along with the Bullish Divergence on the 1D chart.
GRT needs to retest the .20 cent mark and retain this price to have the best likely chance of another strong push.
AGAIN, NOT CONFIRMED YET
NEED TO RETAIN AND RETEST 0.20 LEVELS IF YOU ARE RISK ADVERSE. YOU COULD ENTER HERE, HOWEVER A TIGHT STOP LOSS WOULD BE A GOOD IDEA JUST IN CASE...
I attached my prior setup I posted here for the last GRT Long
GLHF

GRT 4H Chart Bear Flag
A Bear Flag has formed and it seems that it will soon be broken to the downside.
A correction to the gray resistance zone will be an opportunity for short trades.
This view is supported by:
Lack of bullish RSI divergence on the December low
Bearish RSI divergence on the January High
Impulsive move to the downside on the last couple of days.

GRTUSDT longWe had consolidation on H4 chart between 0.2030 _ 0.2330 levels, Price breaks out resistance level, now bulls try to confirme their power. Risk reward 1/2. Good luck!

GRTUSDT looks like FETUSDT!Mentioned the charts below! you know the drill what to do and what not to! Looks VVVVVV STRONG!
Ive mentioned the point of attraction.

GRTUSDT Buying opportunity with Key zone to watchThe Graph coin (GRT) reached an all-time high (ATH) of $2.8807 before entering a significant correction phase that brought the price down to approximately $0.0517. Since hitting this bottom, GRT has been attempting to recover.
The price action has formed an ascending broadening wedge, indicating increasing volatility and potential reversal patterns. Additionally, a strong cup and handle formation suggests bullish sentiment and the possibility of upward movement.
Our immediate plan is to focus on the identified buy back zone for potential entry points, as this area provides a favorable risk-reward ratio for buyers. We recommend setting an initial profit booking point based on the immediate setup to secure gains as the price approaches resistance levels, while also monitoring the price action for the final setup target as shown in the chart.
What are your thoughts on this analysis? Do you agree with this perspective?


#GRT (SPOT) entry (0.1700- 0.2100)T.(0.8300) SL(0.1666)BINANCE:GRTUSDT
#GRT / USDT
Entry ( 0.1700- 0.2100)
SL 1D close below 0.1666
T1 0.2600
T2 0.3800
T3 0.8300
______________________________________________________________
Golden Advices.
********************
* collect the coin slowly in the entry range.
* Please calculate your losses before the entry.
* Do not enter any trade you find it not suitable for you.
* No FOMO - No Rush , it is a long journey.
Useful Tags.
****************
My total posts
www.tradingview.com
1Million Journey
www.tradingview.com
www.tradingview.com
**********************************************************************************************
#Manta #OMNI #DYM #AI #IO #XAI #ACE #NFP #RAD #WLD #ORDI #BLUR #SUI #VOXEL #AEVO #VITE #APE #RDNT #FLUX #NMR #VANRY #TRB #HBAR #DGB #XEC #ERN #ALT #IO #ACA #HIVE #ASTR #ARDR #PIXEL #LTO #AERGO #SCRT #ATA #HOOK #FLOW #KSM #HFT #MINA #DATA #SC #JOE #RDNT #IQ #CFX #BICO #CTSI #KMD #FXS #DEGO #FORTH #AST #PORTAL #CYBER #RIF #ENJ #ZIL #APT #GALA #STEEM #ONE #LINK #NTRN #COTI #RENDER #ICX #IMX #ALICE #PYR #PORTAL #GRT #GMT #IDEX #NEAR #ICP #ETH #QTUM #VET #QNT #API3 #BURGER #MOVR #SKL #BAND #ETHFI #SAND #IOTX #T #GTC #PDA #GMX #REZ #DUSK #BNX #SPELL #POWR #JOE #TIA #TFUEL

#GRT (SPOT) entry range( 0.1360- 0.1660)T.(0.3860) SL(0.1259)BINANCE:GRTUSDT
entry range ( 0.1360- 0.1660)
Target1 (0.2320) - Target2 (0.2890)- Target3 (0.3860)
SL .1D close below (0.1259)
*** collect the coin slowly in the entry range ***
*** No FOMO - No Rush , it is a long journey ***
**** #Manta ,#OMNI, #DYM, #AI, #IO, #XAI , #ACE #NFP #RAD #WLD #ORDI #BLUR #SUI #Voxel #AEVO #VITE #APE #RDNT #FLUX #NMR #VANRY #TRB #HBAR #DGB #XEC #ERN #ALT #IO #ACA #HIVE #ASTR #ARDR #PIXEL #LTO #AERGO #SCRT #ATA #HOOK #FLOW #KSM #HFT #MINA #DATA #SC #JOE #RDNT #IQ #CFX #BICO #CTSI #KMD #FXS #DEGO #FORTH # AST #PORTAL #CYBER #RIF #ENJ #ZIL #APT #GALA #STEEM #ONE #LINK #NTRN #COTI #RENDER #ICX #IMX #ALICE #PYR #PORTAL #GRT ***


#grtusdtAfter a downtrend break and a good pullback, the price can surge at least 50% of the correction.
