GRT Looking good for a bullish movegood RR on GRTUSDT
looking forward to see a bullish move over the coming days
NFA
DYOR
GRTUSDT trade ideas


Increased volumes. Triangle breakdownThe price is in long-term accumulation, there are clear three approaches to the level, the last of which is on elevated volumes, which indicates the strength of the buyer. Potentially, you should expect a local squeeze to the level as confirmation of the trial scenario. I recommend that you go by the fact of breaking through the price of the level with activity in the depth. Goal: 0.9$

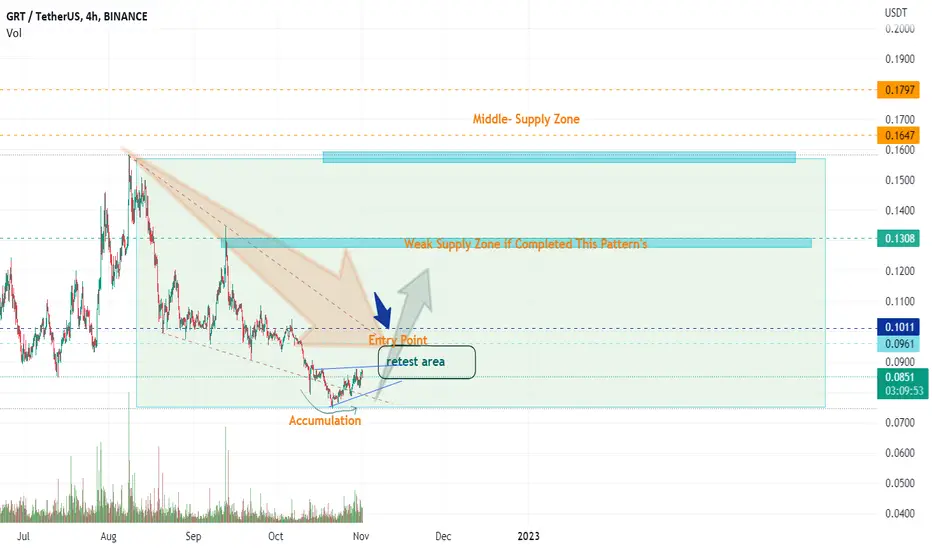
GRT/USDT. We are waiting that price coming back to the yellow area, we need retest that area and close a 4H candle above it, after that we can open a Long till 0,64 surely.
Open 0,05870 * Take Profit 0,064 * Stop Loss 0,057

GRT The Graph LONG TRADE 20221225Demand Zone
Signal: Blue * N in different timeframes
GRT , The Graph, GRTUSD , GRTUSDT, GRTUSDTPERP , CRYPTO,CRYPTOCURRENCY
DISCLAIMER
This is only a personal opinion and does NOT serve as investing NOR trading advice.
Please make your own decisions and be responsible for your own investing and trading Activities.
GRT is about to takeoffHello traders!
Welcome back to another episode with Analyst Aadil1000x.
Today we are buying GRT for a good profit of at least 6% which can go up to 12%.
First, let GRT break the previous high then it will show its strength.
GRT Buy stop 0.05746
Stoploss 0.06502(-2.7%)
Target 1, 0.0609(+6%)
Final Target 0.0640(+11.5%)
Don't forget to hit the like button and follow to stay connected


GRTUSDT Support And Resistance Range The Second UpdateAs you can see, after hitting the price of 0.0690 in the role of resistance, the price decreased and came to the price of 0.0662 in the role of support, which was supported several times, but for now the price of this level has the role of resistance.


GRT The Graph LONG TRADE 20221212Signal: Red -> Green
Context: Green
GRT, The Graph, GRTUSD, GRTUSDT, GRTUSDTPERP, CRYPTO,CRYPTOCURRENCY
DISCLAIMER
This is only a personal opinion and does NOT serve as investing NOR trading advice.
Please make your own decisions and be responsible for your own investing and trading Activities.

GRTUSDT Support And Resistance Range UpdateAs you can see, the price could not make a good break and considering that it broke the downward trend line, but as expected, it came back below the trend line and touched all the support targets.

GRTUSDT Support And Resistance RangeAs long as the price cannot break the downward trend line, the price trend is downward, and if the downward trend line is broken, it can rise to the level of 0.0720.
The support and resistance ranges of the symbol are specified.


GRT 300% potential move GRT / USDT
Price is trading in this massive wedge since feb-2021 and recently we spotted early positive signs
If price made a successful breakout from this wedge , we see a minimum target 200-300% for the bulls in next few weeks
Keep an eye

pull back before coming back upRSI is 80 on 4 hourly chart
overbough also on 1 hourly.
short term short trade can be in order.
entry 0.07240
stop loss 0.07223
TP 1: 0.07193
TP 2: 0.07160
TP 3: 0.07095

All on The GraphGraph is an indexing protocol in blockchains
It probably has a role in ethereum’s stateless future
It can also index protocols such as IPFS
Blockchain is data but querying that data is not straightforward
This looks good for a reversal with bullish divergence building
It needs to break up out of the local structure
Weekly close tomorrow will be important
Let’s see what happens
GRI2022

GRT S&R in short term>>>>>>>>>>>>>Dec 8
Hello EveryOne
I Have Tried My Best to Bring the best Possible outcome in this Chart.
Short term possibilities marked on the chart.
We can buy in deeper correct in Daily time frame.
Depend's on rising market support's in next time.
It's just an analyze,
Not a financial advise.
PLZ DYOR
With hopping success>>>>>>>>>>>

GRT with an inverse head and shoulder and target#GRT 👉 put this on your radar
inverse head and shoulder
with measured move
💥 Set Alert on the neckline
price movement prediction
Price Prediction
not financial advice
this is for entertainment purposes only
always DYOR

GRT Price is still in a rangePrice is still in a range showing no major movements. I expect price to move down and tap into the major 8h demand zone around $0.55 before moving up again from there.

GRT: Is the downturn over yet? Still too soon to tell....Since GRT broke $.31 support, it has pretty much gone into a freefall mode. The Nov low came just short of 1.764 fib extension and also just shy of the bottom of the pitchfork. This still keeps the door open for one lower low. However, the bounce from the low looks somewhat promising. So far, we don't have a 5 wave structure up. If, price can keep moving upward and get toward the median line of the pitchfork and back toward 1.0 fib extension in a 5 wave structure and gets a 3 wave retrace that hold the Nov low, it will have a greater probability of calling a bottom and head towards new highs. All markets are very shaky, so best to wait and watch for now.

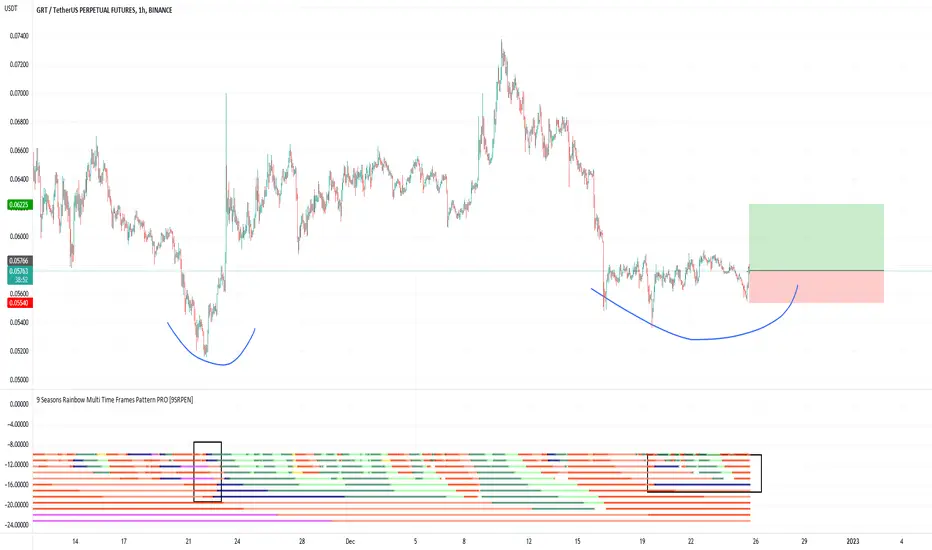
GRT prepared for next move slowly>>>>???? Hello everyOne
I Have Tried My Best to Bring the best Possible outcome in this Chart.
We must still watching to shown sign of prove in volume index for complete reversal GRT pattern's and begin to start upside price.
For prove more rising price,
We expect more bullish movements to reveal themselves in the next day's.
After completed pullback to break's down-trend line area,(possibility)
2ND rising wave's is safer entry point.
All important resistance and support's zone (short-mid term) marked on the chart.
This is not financial advise.
PLZ DYOR
With hopping success>>>>>>>>>>>

grt/usdtTechniacl view of grt :
i want to trade wave 5 of elliot.
you can see that green cross have to come.
price action may be from fib 0.618 or 0.5 .
At rsi we can see that price should hit support line.
so i will place 2 orders one at fib 0.5 and second at 0.618.
Take profit price i measured by fib extension as you can see in the chart.
