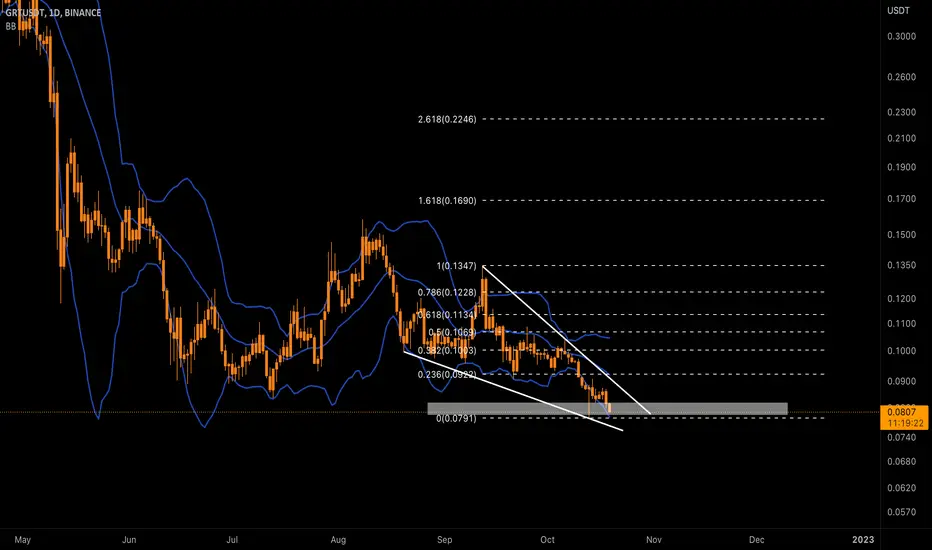
The Graph GRT Crypto Market after the ElectionsMy forecast is that we will see a bearish outcome for the crypto market after the November 8th Elections, especially for The Graph GRT, which is overvalued.
GRT/USDT short
Entry Range: $0.09 - 0.10
Price Target 1: $0.08
Price Target 2: $0.06
Price Target 3: $0.05
Stop Loss: $0.115
GRTUSDT trade ideas

GRTUSDTBig Part of WEB3 this coin is likely to be.
This project has real usecase for querying D'apps on the blockchain and is generating revenue.
60% downside seems reasonable here from my experience 2018 never underestimate how low these projects can go.

#GRT/USDT BREAKOUT AND RETEST READY TO PUMP 250% !Welcome to this quick GRT/USDT analysis.
I have tried to bring the best possible outcome in this chart.
(SPOT CALL)
Entry:- CMP $0,08945
Traget:- 250%
Stoploss:- $0.08191
Hold it for some long time to come, it can give good profit, as BTC will pump, all the calls will give you good profit and most important stop loss
Remember:-This is not a piece of financial advice. All investment made by me is at my own risk and I am held responsible for my own profit and losses. So, do your own research before investing in this trade.
Happy trading.
Hit the like button if you like it and share your charts in the comments section.
Thank you...

#GRTUSDT 4H Chart
Price has previously bounced off a 4h breaker zone and left a 4h demand zone around $0.08 which is also a discounted area. MACD turned bearish, RSI is sold and EMAs are bullish. Price is still overall in an uptrend and i expect it to tap into this demand zone before continuing its upward movements.

GRT Next Bull Run Coming?Entry for Spot Trading: $0.08
The Graph is an open-sourced software used to collect, process and store data from various blockchain applications to facilitate information retrieval. AI and Big Data will be our future.
The GRT cryptocurrency derives its value from its ability to ensure the successful execution of smart contracts that depend on the The Graph protocol.
Most notably, GRT is the only cryptocurrency used for key network operations. For example, consumers who submit queries to indexers must pay a query fee, denominated in GRT.
We need patience, waiting for next bull run. This is Week TF, Future trading is not recommened.
________________________
If this is your first time coming to my idea, thank you very much for taking the time to pay attention to it. My opinions are all subjective and personal. It might be right, or wrong, but there is one thing I can guarantee you will never go wrong - always set the SL for each entry before setting the TP for it.
Don't forget to Follow, and comment your thoughts below, or simply a Boost button if you found it helpful. That encourages me a lot to share my ideas!

GRT ABOUT TO BREAKOUT GRT has been descending for a while now, expecting a break to the up side from this Falling Wedge , I believe it will drop from that resistancezone around $3, it will be wise to TP there, cheers 🍻

GRT is ready to go higherSo as you see in the chart, GRT has completed a WXY correction, and with a divergence in price and rsi, the price broke its trendline, and it's ready to jump up to a significant trend. hopefully, it can break, and we will see around 1.6 dollars for GRT very soon

GRTUSDT | BULLISH SIGNSGRTUSDT has been trading under the falling resistance.
The price has printed AB=CD pattern. This pattern is considered as a trend reversal pattern.
The price is currently trading near the falling resistance.
The break above will bring complete control of bulls.
Trade your levels accordingly.

GRT will follow MASK ?The Graph (GRT) is an open-source, decentralized indexing protocol for blockchain data. It is designed to allow queries on the Ethereum network. The Graph network also allows developers to construct/use various APIs known as subgraphs for separate queries.
The prices have been consolidating since mid May in a range and almost static, lately. However, as seen in charts, we can see why it is interesting to pay attention on GRT now, specially when being compared with MASK.
Similar pattern as MASK before it jumped almost 200% in a few days: prices dropped 80% in April and has been ranging since.
MFI indicator: The local trendline was broken. If buy pressure is maintained, it is likely that the longterm trendline will be broken, as well.
Let's see how GRT will progress the next days (or weeks).

#GRTUSDT 2H Chart
Price is overall in a downtrend and it recently left a 2h supply around $0.086. MACD is not clear, RSI is sold and EMAs are bearish. I expect price to move up towards this area of supply where we would be looking to short from aiming for a new lower low.

GRT continued its decline over the past week!GRT continued its decline over the past week, breaking the support of the $0.083-$0.090 range, reaching $0.080. This price is a new floor in the trading history of GRT currency, which can still be a sign that the trend of this currency is completely bearish. The downward corner pattern that was considered for this currency was not only not confirmed, but the validity of the corner pattern has decreased. But for this week, very reliable support is considered in the range of $0.0800-0.0835, and the shadow of one of last week's candles penetrated this range but positively reacted. In the 4-hour time frame, there are good reactions to this support range. If the short-term upward trend of Bitcoin continues, the probability of a strong return from this support range is high. Therefore, you can monitor the specified support range for the current week.
GRTUSDTGRT its like Google for Blockchain ! it follows allways ocean, ocean did it up and now we w8ing GRT now its brilliant pointer to get enter in GRT > 0.082
dont misse it !
be rich get ready !
^^
||

GRTUSDT 4H❌These analyzes are just to give a better perspective for you dear ones
Do not base on buying and selling❌


GRT
#GRT/USDT
Exchanges: Binance
Signal Type: Regular (Long)
Amount: 2.0%
💎 Entry Targets:
1) 972- 953
Take-Profit Targets:
Target 1: 997
Target 2: 1022
Target 3: 1067
Target 4: 1093
Target 5:
Target 6:
Target 7:
Target 8:
🚫 Stop loss:
928

GRT USDT #graphToken is Bullish ?I expect an exciting move from the graph
By leaving this descending triangle, we can see the growth of the graph up to 22 cents and 35 cents
risk management
Your own risk

Little Profit with GRT, 47.68%A little profit with GRT in step 1 (TP1).
TP1: 0.105 ✅
15.89% (1x), 31.79% (2x), 47.68% (3x) 😍👍
See my previous idea!
Follow me! Copy my trades!
TradeSetup_Reza

GRTUSDT needs to hold the supportThe price is testing the 4h static and dynamic support at 0.1$ area after a rejection from 0.11$ area where the market has the static daily resistance
How to approach it?
IF the price is going to lose the support and retest as new resistance, we could see a new bearish impulse until the daily support area, so According to Plancton's strategy , we can set a nice order
–––––
Keep in mind.
🟣 Purple structure -> Monthly structure.
🔴 Red structure -> Weekly structure.
🔵 Blue structure -> Daily structure.
🟡 Yellow structure -> 4h structure.
⚫️ black structure -> <= 1h structure.
–––––
Follow the Shrimp 🦐

GRT Pinched to the DOME About to see some serious price action. Literally a steep falling wedge which means a sharp bounce back. Lets hold 0.096, down from 1.30. Can't go down more or its going to be a weird looking chart.

grt short trend line
⚡️⚡️ #GRT/USDT ⚡️⚡️ tweet my channel free
Exchanges: Binance Futures 🚀
Signal Type: Regular Short
Leverage: Cross (X20)
Amount:0.50%
Entry Targets:
1) ******
2) *******
3) ****
Take-PrOfit Targets:
1) *****
2) *****
3) *****
4) ****
5) *****
6) ****
7)
8)
9)
Stop Targets:
1) *****


GRT DAILY! Following through price action?Here is a potential outcome for GRT. This chart is currently meeting all the criteria for a reversal, but we are still not out of woods yet. We have Class A bullish divergence on the oscillators, as well as retracting to the .866 while in the golden pattern completion zone. We are getting some thrust and now we will see if we get that follow through price action and really bust out. Obviously this is BTC depending, but this asset performed very nice in the last run where it was in the high $2s… ANY asses that loses its value 98% will be very appealing to experienced and seasonal traders as the value potential is out of this world. This is where where the whales go and start bottom feed. To the depths of the ocean to become big and strong while the smaller fish get scraps at the surface while taking the fishermen's bait just to get yanked in, chopped up and spit out. Be a apex predator, not a clown fish. Own the top off the food chain….

GRT Chart Analysis.....GRT is falling from since its ATH now it is moving its ATL so there is great opportunity for us to make our assest 5 to 20x if bull run raily start which i am seeing coz september is good for all the crypto.....
GRT is WEB3 Project which is future so there is great potential in this coin in the future for long term.....
#GRT #crypto #WEB3 #TA #fundamentalanalysis #BTC #ETH
