grtusdt hold on project with good future hold on at this price this area is excellent for accumlation
GRTUSDT trade ideas

Will we return to the starting price?Here I draw my predictions for next week.We see that we are close to strong support (currency launch support) at 0.29090, so in the coming days if we see pump in Bitcoin price, we will go to the 0.38 area, and there will be resistance.

🌀GRT- Expanding wedge accumulationThe price reached previous accumulation zone and formed an expanded wedge (increased volatility)
If we see a breakout from the formation followed by a successful retest of current local resistance (~0.38) we can expect another bullish wave soon.

GRT/USDT HAS POTENTIAL TO PUMP 200%!!Hi guys, This is CryptoMojo, One of the most active trading view authors and fastest-growing communities.
Do consider following me for the latest updates and Long /Short calls on almost every exchange.
I post short mid and long-term trade setups too.
Let’s get to the chart!
I have tried my best to bring the best possible outcome in this chart, Do not consider it as financial advice.
BUY GRT/USDT
Entry range:- $0.356TO $0.3
Target:- 200%
SL:- $0.25
This chart is likely to help you in making better trade decisions if it did consider upvoting this chart.
Would also love to know your charts and views in the comment section.
Thank you

GRT BOMB ABOUT TO BLOW UP!!!GRT is currently battling a truck load of resistances: 50 and 100 MAs, the descending trendline and the Horizontal level.
You know what to do if these resistances give way. Targets are on the chart.
Remember that this is not in any way a financial advise. DYOR and manage your risk properly.
Best of luck from Commodore!

GRTUSDT LONG SIGNALNice to meet you, everyone
I'm an alt trader
I'm analyzing and recommending things that are similar to my personality among many alt coins
Enter when it crosses the downtrend line
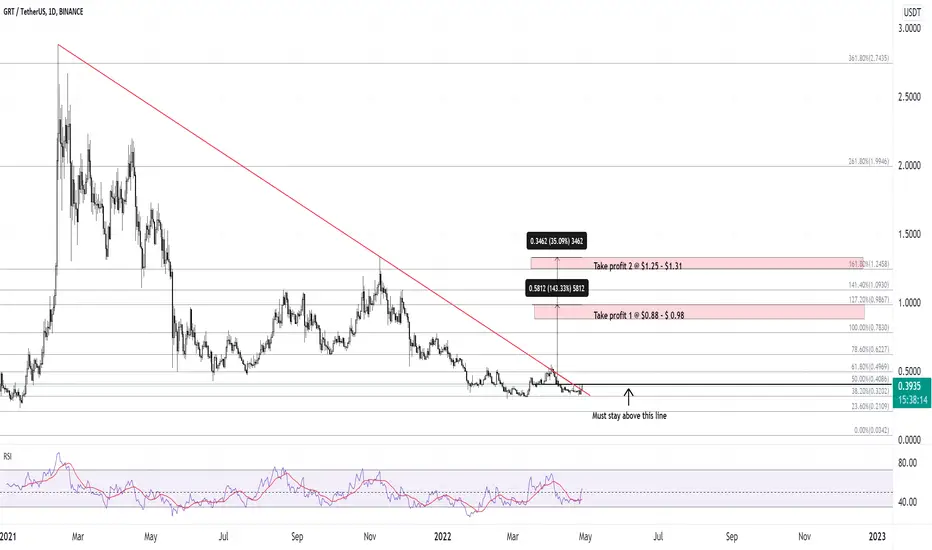
GRT Analysisall necessary points Like Entry point, stoploss and take profits are determinded in chart.

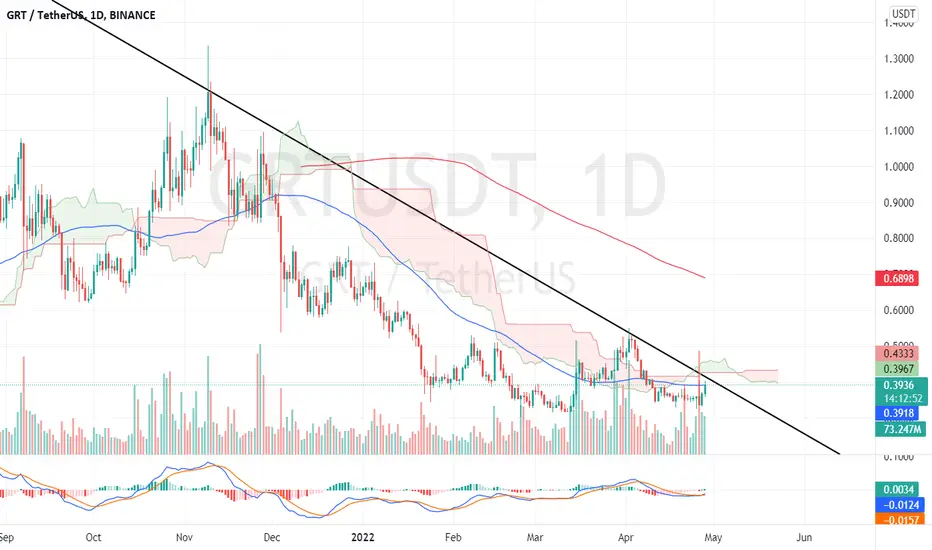
GRT finally gets a proper breakout - and RSI above 50TLDR: GRT breaks resistance with rsi above 50, yet BTC drop looms around, so it is best to wait for GRT to drop a little and find a support.
GRT has finally broken the resistance line from the top, and is near the bottom of the triangle formation.
The sell zones are highlighted on the chart.
Caution:
1 - To continue trending it must stay above the line mentioned in the chart.
2 - There is a high chance that BTC will drop to the 37k range, at which point GRT will come down to retest this resistance line it's been stuck under. This would be the most ideal time to buy.
GRT condition!!!Hello traders...as you can see in my chart we have a disjoint channel and after breaking it we can expect a good rising

GRTUSDT is testing the supply zone as resistanceThe price is testing the weekly resistance after getting the liquidity as I told you in my previous idea.
on the 4h timeframe the price is creating a descending channel below the 4h supply zone where the price got a rejection.
How to approach?
The price needs to have a breakout from that area and flip the supply zone into new demand zone. so According to Plancton's strategy , we can set a nice order
–––––
Keep in mind.
🟣 Purple structure -> Monthly structure.
🔴 Red structure -> Weekly structure.
🔵 Blue structure -> Daily structure.
🟡 Yellow structure -> 4h structure.
–––––
Follow the Shrimp 🦐

Small Cap alt coins trending, GRTGRT is currently showing strong signs of an uptrend where DMI and MACD are showing an positive trend and the RSI is showing signs of steam ahead.
Something to note is that this chart is dependent on the Bitcoin chart and if there is strong negative momentum in the Bitcoin chart may this change the berhaviour of the GRT chart.
There is an distinct bottom placed at 0.3503.
Entry slightly under the market price at around 0.39.
Stop loss roughly 5% under entry at 0.38 to 0.385 range.

GRT is Ready For SHORT PositionGRT /USDT is Going to get a good setup for SHORT POSITION you
can get this position with LEV11 X
Good Luck & dont forget to set SL & TP

GRT trading plan 15min and 5min MACD both showed signals to short,resistance ahead (shorting at 0.385)

GRTUSDT bearishHello Birdies, We are trying some new charting methods.
As you can see this fib line is behaving as resistance, support, resistance and resistance again.
Targets are on the chart, @plancton0618 we both getting same results waiting to see your feedback.

GRTUSDT wants the demand zone?The price is testing the support on 0.35$ after a rejection from 0.40$ weekly resistance. If the market is going to hold the support we could see a Inverse head and shoulder, But if the price is going to lose it, we could see a new bearish impulse unit the demand zone on 0.32$
So how to approach?
We are waiting for the breakout to the downside, According to Plancton's strategy , we can set a nice order
–––––
Keep in mind.
🟣 Purple structure -> Monthly structure.
🔴 Red structure -> Weekly structure.
🔵 Blue structure -> Daily structure.
🟡 Yellow structure -> 4h structure.
–––––
Follow the Shrimp 🦐

GRT AT BOTTOM???This is very risky trade but risk to reward is very small.
So enter at about 0.3195
sl 0.3139
tp1 0.48
tp2 0.65
Reason behind this trade is break ofs trucutre on 4h timeframe and grt is currently in weekly demand zone that caused pump of 2.8
This is risky trade because of btc movement also but we will see. Risk is only about 1 % (times your leverage you use) and possible profit is 60%
Giving out 1:60 rr
This tread depnds only on btc movement.

GRTUSDTGRT has bullish signal, Yesterday we saw panic sell of crypto traders because of the BTC pullback (I think the main reason is the first day of the week) Hope this week will be bullish for us.
Good Luck!

THE GRAPH The price is showing a strong bullish signal supported by M.A RSI SYS and Shark harmonic pattern and upside down head and shoulders pattern
Have a great luck 👍

GRT I think GRT is almost ready to fly
there are 2 scenarios white and yellow ones eventually it will hit the targets at least T1 ( for long/mid term )

grt usdtAn update for Grt forgot to add the path , but yeah this is it. Time frame wouldn't know. Good luck

GRT USDTHere another different Wyckoff exactly if it works out that's big , Good luck guys.
Can't post the picture of this Wyckoff but you are welcome to google it , there is different ones.


GRTUSDT : LOOKS BULLISHThere is nice inverse Head & Shoulders pattern developing on the #GRT daily chart ....
Target 1 - the neckline
Target 2 - iH&S target
