GRT LOWEST PRICE IN NEXT FEW MONTHS???Grt is by my opinion one of most bullish coins.
Here is why:
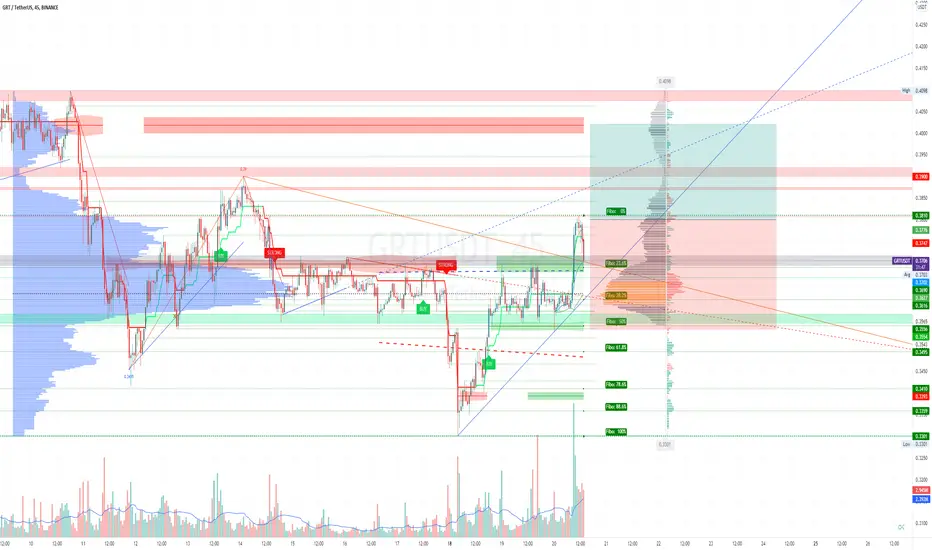
GRT is currently in weekly demand zone which reaction broke structure on 1day timeframe.
Also GRT is in demand zone from 1d and 4h from all break of structures.
You can go for few months long investment till 2.8 usd ( which I think is reachable) or go for swing trade and tp at 0.7 or 0.6
Remember do not use high leverage, everything above 5x is too much and not needed since even profit without it is so big.
ALL BUYS IN THIS DEMAND ZONE AS LONG TERM ARE GOOD BUYS.
For swing trade its your choice to choose from which point of demand zone you want to enter. This chart is similar to btc chart which makes this even better and safer trade
SL should be below both demand zones
GRTUSDT trade ideas

GRT - Your time has come, Enekin!🥊- BTC bullish
- Trend bullish
- Lots of touches
- Level visible on daily timeframe and under
- Over VWAP
- ATR 50
- False breakout happened
- When print will go faster and base on 5m tf near the level will appear, I'll enter
Close by parts:
1% - 1/3
2% - 1/3, stoploss to breakeven
The rest we keep to reach maximum potential
What do you think of this idea? What is your opinion? Share it in the comments📄🖌
If you like the idea, please give it a like. This is the best "Thank you!" for the author 😊
P.S. Always do your own analysis before a trade. Put a stop loss. Fix profit in parts. Withdraw profits in fiat and reward yourself and your loved ones

THE GRAPH (GRT) ABOUT TO EXPLODE!!@@GRT is looking very sound, crypto god don't do it to us again. Next 3 months should TERRIFIC


GRT GOING FOR 8X ( SIGNAL SWING TRADE)GRT hasnt been pumping last few days from demand zone as much as best coins which doesnt mean it wont.
GRT is extremely bullish coin by my opinion. We had break of structure on 4h timeframe and its slowly getting to demand zone that cuase bos.
On 1d timeframe it had change of character which is insane.
WHY I EXPECT IT TO HIT ATH:
-Grt is currently in 1 week demand zone from past
-It had break of structure on 4h timeframe and change of character on 1d timeframe which is very bullish singn
-Also its been going down after being in big hype and I think its time to make him come back in hyped coins
-USDT Dominance is in its supply zone on 1d timeframe which will make usdt dominance go down and all other coins go up
Literally all signals I posted from past were right so I will try to keep it as that. If you followed some of my buy signals I posted you will be in at least 20% profit without any leverage.
ALPINE 60%
LUNA 30%
JASMY 50%
ZIL 20%
APE 60%
ALL in about a week.

GRTUSDT bullish setup This asset has arrived to a great support zone , it’s a nice bullish setup worthy for 3 % of portfolio
Entry ≈ 0.33 0.37
Targets : 0.4 - 0.43 - 0.48 - 0.54 - 0.7
Stop loss : 0.31
(3x-5x) leverage recommended
2022-04-20 (333)

GRT may go up to $0.77Hello, trading view community. Should you like this analysis please support with likes and comment your idea below the analysis. Thanks.
Never risk more than you can afford to los.
Always DYOR.
GRT had really hard time with its downtrend channel, but now it seems that GRT is going to break it up, if a green candlestick forms above the trend line it would be a very good signal to go long. Then the monthly resistance zone will be the next challenge.
on condition that GRT can break the aforementioned resistance level then it will pave its way to $0.77 which is a very important daily resistance zone which is marked on the following screen shot
from the point we are standing now up to thetarget there are several weekly resistance level, as following
$0.53505
$0.61908
which may regarded a TP points.
in any case, if BTC went wrong again, GRT may fall to $0.29888 support zone which is a weekly one.
Monthly zones in red
weekly zones in blue
daily zones in green
This is a personal idea, and I am not a financial adviser.

GRT started breakoutHey, $GRT is forming some very nice structure and will soon test the resistance. Im long with x10. Targets on the chart!
GRT breaked mid term down ternd and about to break importatnt isif 4hr close like this we can have that bullish scenario for GRT ,make sure comment below your idea ...PEACE

$GRT.X/USDT - Short - Potential 11.90%$GRT.X/USDT - Short - Potential 11.90%
Exchanges: Binance Futures
Signal Type: Regular (Short)
Leverage: Isolated (1X)
Entry Targets:
1)0.3606 - 100.0%
Take-Profit Targets:
1) 0.3477 - 50%
2) 0.3301 - 30%
3) 0.3167 - 20%
Stop Targets:
1) 0.3820 - 100.0%
Entry Trigger - Bearish TD9 on pullback
Trailing Configuration:
Entry: Percentage (0.0%)
Take-Profit: Percentage (1.0%)
Stop: Breakeven -
Trigger: Target (1)

grtThe Graph price is $0.37, a change of 4.74% over the past 24 hours as of 6:16 p.m. The recent price action in The Graph left the token’s market capitalization at $3,784,514,002.94 USD. So far this year,


GRT POSSIBLE 8X ???Grt didnt shad some special movement since it pumped hard. But now on 1D chart I noticed change of character(choch),
for those of you who dont know choch means that trend is going to change and probably cross current swing high which is at 8x from here.
That means it very possible that in next few month grt will even make 10x
This all is confiremd on btc chart and btc looks like it will do similair as grt.
NOT FINANCIAL ADVICE!!!
Best buy ( for future traders would be below 0.33) and for long investors all times are amazing to buy since its in weekly demand zone .

$GRT ready to fly $GRT one of the best ALT :
As per the chart :
We have a strong resistance level at 0.7742 as a daily resistance which should be broken so that we can see a new ATH for GRT however , it should not be traded under 0.3172 the golden support level; I can see that GRT can do the same like the greatest explosion on 31 Jan 2021 once GRT jumped from 0.7742 , it reached to 2.8$ (ATH)
It is not a financial advise

GRTUSDT (Long)GRTUSDT is in trend reversal with inverse head and shoulder forming at D support level.
Buy above 0.57
SL at 0.45
TP1 at 0.75
TP2 at 0.93

GRTGRT - Overall Pattern is an ABC in which Wave B, which is a 3 wave structure is currently ending. Whether we will extend this correction will happen after we reach our target so reaching the target area is a sure shot.
Total trade has a potential of 4x. Stop loss mentioned. Currently in wave 4 of Wave c of overall Wave B. We should see trend moving a little higher after which we should see a downtrend towards our target.

Descending Triangle GRT is forming a descending Triangle on weekly TF,, it has two support left to break.lets hope one of them holds. so we wait for a breakout of structure


GRT move GRT has found a stop although you have to take into account the future movements of the BTC grr you can get carried away with a possible rise there I leave the price options, keep in mind that for it to be valid you have to exceed the 0.23 area that would be a command 0.40 to 0.41 to overcome and look for that .38 of the fibonacci in the 0.42 to 0.43 range if we do not exceed the first described range we have looked for a support below for a possible future rise without further my appreciation and the variables to take into account.
do not take this analysis as an investment advice only as didactic and educational material..

Order BLock.I picked my order BLock on my H4, so I have a setup to monitor the bearish trend for a possible trend reversal.
the white line is my entry (the close of the last daily candlestick),
the red line is my stop loss (10 pips below the wick of the longest dipping candle 🕯️ stick)
the yellow line will indicate a bearish trend with a breakout and pursue my downtrend trendline and 200EMA.

grt looking good grt looking good to accumulate down here
could see a nice move up if we break the down trend

GRTUSDMarket structure has now been broken and we are bullish on the weekly timeframe . Daily timeframe we have a Quasimodo and a liquidity void that needs to be filled, this is our entry long @ 0.3933
We have a strong support on the weekly timeframe coming in @ 0.3313
Strong resistance levels are as follows:
0.5990
0.6806
0.7448
Tp 1 @ 0.6267
Tp 2 @ 0.8414
Tp 3 @ 1.3500

GRT - Top-Down Analysis!Hello TradingView Family / Fellow Traders. This is Richard, as known as theSignalyst.
WEEKLY: Right Chart
GRT is overall bearish however, it is approaching a strong demand zone in green so we will be looking for buy setups on lower timeframes.
DAILY: Left Chart
GRT is forming an inverse head and shoulders pattern but it is not ready to go yet.
Trigger => For the bulls to take over, we need a momentum candle close above the gray neckline.
Meanwhile, until the buy is activated , GRT can still trade lower inside the demand zone.
Always follow your trading plan regarding entry, risk management, and trade management.
Good luck!
All Strategies Are Good; If Managed Properly!
~Rich
