GRT/USDT BUYING SETUPRT on sideways movement , expecting breakout sideways movement cause have a big buy volume accumulation on support
If breakout , upward movement make new higher high 🚀
Target mentioned in the chart
Stoploss : $0.345
Risk : 5%
GRTUSDT trade ideas


#GRTUSDT 4H Chart
Price is currently retesting the 4h demand zone. MACD is not clear but RSI and EMAs are both bearish. Price needs to close above $0.34 to continue moving up else price will dive down towards the untested 12h demand zone at $0.29.

GRTUSDT (Long)GRTUSDT in an upward trend, making higher highs and higher lows
Long
Entry at 0.3450
Take Profit at 0.3517
Stop loss at 0.3387
Risk/reward ratio of 1:1


GRTUSDT wants to retest the daily resistanceThe price had a bounce on the daily support on 0.31$ as you can see on the upper chart.
on the lower timeframe ( 4h on the lower chart) the price is having a breakout from the 4h dynamic resistance.
How to approach?
We could see a pullback on the daily support before a new bullish impulse above the 4h resistance on 0.37$. If the price is going to grab liquidity we could see a retest of the daily resistance at 0.40$
Don't forget, a breakout it's not enough to open a new position, you need to have a strategy
––––
Keep in mind.
🟣 Purple structure -> Monthly structure.
🔴 Red structure -> Weekly structure.
🔵 Blue structure -> Daily structure.
🟡 Yellow structure -> 4h structure.

GRTUSDTHello Crypto Lovers,
Mars Signals team wishes you high profits.
We are in the 4-hour time frame. The price has broken the resistance line and is coming up. It will most likely form a H&S pattern. If the price is rejected from the resistance zone, it will fall down to the support zone. If the support zone is broken it will fall further down.
Warning: This is just a suggestion and we do not guarantee profits. We advise you to analyze the chart before opening any positions.
Wish you luck

GRT SHORT 4HGRT/BTC looks Bad
BTC also needs to dump at some point very soon
the combination makes a Low Risk/High Reward trade for GRT SHORT, 1:6
RSI also broken down under RSI MA

grt breakout potentialgrt is looking great to accumulate down here,
could potentially be close to breaking the down trend

The Graph GRT Price Targets and Stop LossEntry Range: $0.32 - 0.40
Price Target 1: $0.53
Price Target 2: $0.75
Price Target 3: $0.86
Stop Loss: $0.29

GRT/USDTI am expecting a breakout within 66 days for GRT, I have measured the first potential target

GRT 3-2-22Chart is as folllows, wait for pullback to open long position, after pullback make judgement on a stop loss, good luck!

GRTUSDT is testing the 4h resistanceThe price tested the weekly support on the 0.33$ after a rejection from the daily resistance of 0.48$.
On the lower timeframe, the price is testing the 4h resistance at 0.38$ .
How to approach?
The price is in the consolidation phase below the resistance and dynamic daily resistance. We are waiting for the breakout of it and retest as new support. Of course a breakout is not enough, the market needs to satisfy our rules for a new long position
––––
Keep in mind.
🟣 Purple structure -> Monthly structure.
🔴 Red structure -> Weekly structure.
🔵 Blue structure -> Daily structure.
🟡 Yellow structure -> 4h structure.

GRTUSDT - Short by Supertrend 2/28/2022- 4h timeframe: Supertrend indicator > Short.
- 1h timeframe: wait a correction waves (Long trend), open Sell when the Correction waves be broken to Short following the 4h trend.
- Commission: 0.06% (Binance future)

$GRT 10-20x opportunityMid term (1-3 month).
Take profit 1: 5$
Take profit 2: 10$
Stop loss: 0.35$
Do your own research.

GRT/USDT2 HOUR UPDATE Welcome to this quick Update, everyone.
If you are reading my updates for the first time do follow me to get more complex charts in a very simplified way.
I also post altcoin setups on Spot, Margin, and Futures.
I have tried my best to bring the best possible outcome in this chart.
GRT/USDT is making this bullish expanding Triangle pattern.
Entry: $.348- $ 0.349
Targets- $.37 - $0.383- $0.401- $0.42 - $0.4355
LEVERAGE-5X - 10X
Stop Loss: $0.34
What's your thought on this?
Do hit the like button if you like this update and share your views in the comment section.
Thank you
#PEACE

GRT/USDT LOOKING GOOD FOR LONG !Risky trade Due To Market Correction !!
DISCLAIMER: ((trade based on your own decision ))
<>

GRTUSDTGRTUSDT ... i think that GRT will make good profit n the next few weeks. Will take profits at the second Target and wait the breakout oof the big triangle.

#GRT LONG X 310 Target 🎯
as soon hit target 2 move the stop loss to the (Breakeven)
✔Remembering to realize profit on each target!
🏆Making profit never leaves traders poor

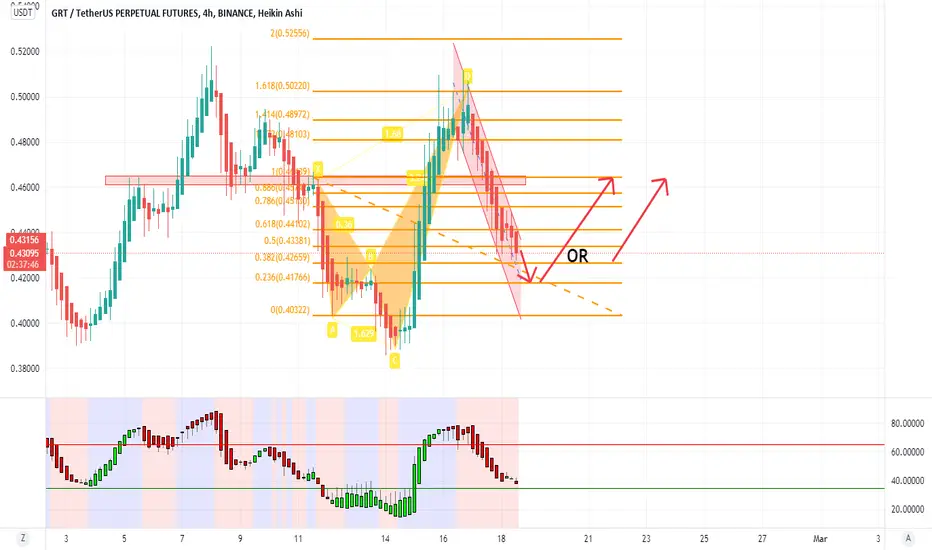
Probable ScenarioA past XABCD Pattern on 1.618 + a continuation chart pattern and a resistance lvl not tested could be a good oppurtinity to long.
If a candle pattern shows off at the actual lvl (0.382) it could be a good entry.
#GRT LONG X 310 Target 🎯
as soon hit target 2 move the stop loss to the (Breakeven)
✔Remembering to realize profit on each target!
🏆Making profit never leaves traders poor


GRTUSDT Analysis (perspective a couple of months)Hello friends.
Please support my work by clicking the LIKE button👍(If you liked). Also i will appreciate for ur activity. Thank you!
Everything on the chart.
GRT will rise from the current price or through 0.3$.
Entry: market and lower
Target: 0.52 - 0.65 - 0.85
after first target reached move ur stop to breakeven
Stop: (depending of ur risk). ALWAYS follow ur RM .
risk is justified
Good luck everyone!
Follow me on TRADINGView, if you don't want to miss my next analysis or signals.
It's not financial advice.
Dont Forget, always make your own research before to trade my ideas!
Open to any questions and suggestions.
