MORE BEAR RUN FOR $GRTHello friends,
GRTUSDTP
As at the time of writing, $GRT is currently trading at 0.4295 support level and at 85.53% below its ATH. The last price action period was 15th October to 20th November with the bears gaining momentum and pushing the price further downward creating local lows. apparently, this protocol is very close to touching its ATL at the Fib level of 1.
However, a possible Elliot's Wave pattern formation is in play with the first, second and 3rd wave almost completed if price should fall below the support its currently trading. If that happens, then support becomes resistance and we are to see price form another local high signalling the end of Wave 4 before falling below current Fib.
The direction only encourages short trades DCA to bag more....(I think).
Trade carefully as this might not be a Financial Advise due to the volatility of the crypto space.
Thank you for reading, please your comments below as i would love love to hear your views
GRTUSDT trade ideas

Descending Inverse Head and Shoulders on The Graph!Hey traders,
As you can see on the 1HR of The Graph (GRT). The price has formed an inverse head and shoulders with a descending neckline/ resistance. To find the inverse head and shoulders price breakout target, you measure the impulse move of the head and add it to the top of the neckline. This is cool and all but as a bonus, we additionally have a Bullish Divergence on the Momentum Oscillator (RSI)! This makes me really confident we will see a small recovery of +5% in the immediate short term. Set your TP for .437.
Safe trading,
-Pulkanator

GRT/USDT - Range Trade - 100% profit from entry.In my opinion The Graph (GRT) still is undervalued with around 2,800,000,000$ market taking 51th place cmc. 100% is very likely to hit this quarter.
Tight stoploss is part of my strategy. Sometimes I might catch stoplosses 2, 4, 6 times before reaching TP.

GRTUSDTthere is a strong support area confluence with small trend line third touch if the price reaches to the support area
then look for buy setup , volume , candlestick pattern.
Please follow and like the idea for Support and More ideas like this and share your ideas and charts in Comments Section..!!
Thanks for Your Love :)

GRTUSDT, We are going to reach to Prz levelGood night guys
GRT is one of the most powerful project that is working on many property and its amazing, its one the coin that everyone should have a little on portfolio.
If you want to learn Fundamental & Technical analysis send us messages ---> Our id is in profile
According to the chart and last analysis that we shown was the price completed Wave B and we need to completed Wave C .
We shown on chart 2 zone that the price can swing in there and the price is coming to reach to the PRZ level and we can take singal in there and buy some GRT and wait until the target reach, Until now the trend of the GRT market is downward.
We will update target after Wave C completed.
If you have any question send us messages
Good Luck
Abtin
Previous analysis :


GRT Hesitancy is BearishGRTs hesitancy to reclaim 'supply zone' has me thinking it's going to 28 cents. A lot of coins had nice but meaningless pumps up, GRT hasn't meaning bull pressure was only enough to keep it from dropping more. Bears will have their way soon.

GRTusd Buy timeHello traders!
Overall GRT is very bullish today and we will buy at the previous low. Normally GRT is slow-moving pair but today I think it will not take time to move 5.5% after our entry.
Sent Entry/limit at 0.434
Stoploss is at 0.4284 (-1.2%)
Target 0.458 (5.6%)
Don't forget to hit the like button and follow to stay connected

GRTUSD BEARISH SCENARIO OUTLOOKGRT/USDT
H-L-LH-LL etc..
Bearish structure very strong and clean
Big Probability GRT will retest and make new LH (Lower High)
We can wait reaction from that area (BLUE LINE)
#tipsfortradingplanning

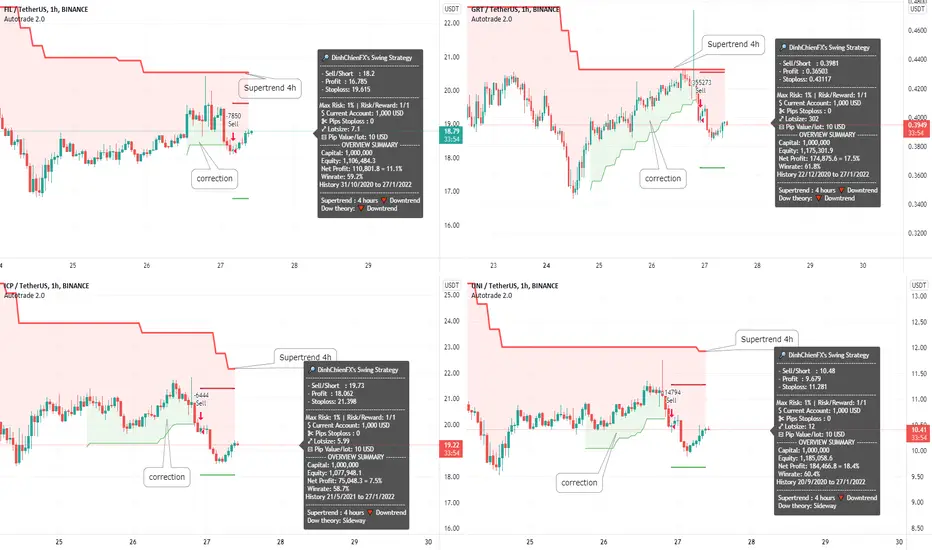
4 coins short signal by Supertrend- H4 timeframe: Supertrend for Short.
- H1 timeframe: Wait a correction and breakout to open Sell follow the H4 trend.
* Author uses to autotrading Binance future.
Commission = 0.06/trade.
Update For GRT/USDT Analysis 📈📉APIs for a vibrant decentralized future
What Is The Graph (GRT)?
The Graph is an indexing protocol for querying data for networks like Ethereum and IPFS, powering many applications in both DeFi and the broader Web3 ecosystem.
The Last time that I had an analysis for GRTusdt in exactly hitted all of my Tps and even went beyound
so now
-----------------------------------------------------------------------------------------------------------------------
📈📉 TECNICAL ANALYSIS
As you can see on the weekly timeframe for pair of GRTUSDT , Its trading about $0.4 right now .
GRTUSDT has been declining in a descending channel , and as we can see , after breaking down of ascending trend line it also loses an important key levels as support which is now a strong resistance zone between (0.58$-0.73$) .so in this situation of crypto marke it can go down more likely , and drop to next supports and Fibo levels respectively . otherwise but if it be able to jump above the resistance level with enough volume it can reach to the tps , but at this circumstance of market it have low chance right now to have a sharp rise as before , because it depends to total situation of market especially ethereum .
🛑resistance level: 0.58$-0.73$/ 1.6$-1.9$ /trendline of channel
❇️support level: $(0.25-0.3) / fibo levels
--------------------------------------------------------------------------------------------------------------------
👉This analysis is my personal opinion ,not a financial advice ,so do your own research.
💜 if you're a fan of my analyses PLZ follow me and give a big thumbs 👍 OR drop comment 🗯💭
🙏with Best Regards

GRTUSDGRTUSDT
I think the price is coming back from this range
You can enter the purchase by determining the loss limit

The Graph broke trianglePrice broke the symmetrical triangle pattern and is making a pullback. We can watch for short positions.

GRTUSDT GLOBAL VISION (+200% potential from here)Hello friends.
Please support my work by clicking the LIKE button👍(If you liked). Also i will appreciate for ur activity. Thank you!
Everything on the chart.
Nothing has changed from my last idea.
Perspective a couple of months.
Entry: market and lower
Target: 0.8 - 1.15 - 1.7
after first target reached move ur stop to breakeven
Stop: under 0.45 (depending of ur risk). ALWAYS follow ur RM .
Risk/Reward: 1 to 10
risk is justified
Good luck everyone!
Follow me on TRADINGView, if you don't want to miss my next analysis or signals.
It's not financial advice.
Dont Forget, always make your own research before to trade my ideas!
Open to any questions and suggestions.


THE GRAPH NETWORK HAS A ROADMAP TO DOUBLE DIGITS!Merry Christmas Eve fellow Traders and Happy Holidays!
Today we wil consider the trading pair GRT/USDT.
Recently we put out ideas on SUSHI, LUNA, AVAX, 1INCH etc. talking about first wave extensions and their price targets for 2022 (all linked below btw).
This, we will do a similar idea for GRT.
As you can see in the chart above, GRT has had a 9500% growth in price from it's listing last december up until February earlier this year and has since been in accumulation phase spanning almost a year so far (315 days) marking it's correction phase (wave 2).
If we take our fib retracement tool and draw from its opening price at listing date up until it's ath in february, we see price stopped just underneath the 0.382 fib support (which is the basis for a 1st wave extension, coupled with a lengthy accumulation phase).
To get our targets for the 3rd wave, we then take out our fib tool again and measure from it's ath to the 0.618% level of the 1st wave and target just under the 1.618% level for wave 3.
I have added in the 1.5% level for clear targets.
This would give us a price target of around $11.8 - $16.4 should we touch the 1.618 fib resistance.
If you agree with this idea, please leave a like below and share your thoughts in the comments section.
Feedback is always appreciated.
Merry Christmas AGAIN!
