GRT New Bullish Impulse StartedGRT has had two significant bullish impulses over the last two years. With price action picking up again over the last two weeks, I'm betting that we're seeing the start of the third GRT impulse.
Note the bottom dotted support line. This has held for the last two years, and is likely to do so for the time being.
I'm looking for a move towards 1$. Stop below the recent swing low.
GRTUSDT trade ideas

[GRTUSDT] ON THE VERGE OF BREAKING OUT!BINANCE:GRTUSDT a trendline of more than 6 months on the verge of breakout in 7D chart.
weekly close above 0.236fib level(at price of0.177$) meaning a price explosion ahead.
incase that happen expect 300% bullish
Best regards Ceciliones🎯


$GRT in the uptrend CHJSE:GRT is in an ascending channel and it can be good for long-term/mid-term investment if you are patient and enter at a good point.

GRT LOOKS BULLISH (12H)From where we placed the red arrow on the chart, it seems that the GRT correction has started.
The correction was a diametric that has ended
Now we put in GRT bullish waves.
By maintaining the green range, it can be pumped up to the red box.
The targets are listed on the chart.
Closing a daily candle below the invalidation level will violate the analysis.
For risk management, please don't forget stop loss and capital management
When we reach the first target, save some profit and then change the stop to entry
Comment if you have any questions
Thank You

GRT potential long term targetsGRT / USDT
We are still in the same cycle since beginning of 2023 with macro bull market HH and HL structure intact
Whats next ?
Here i can see a high potential upside movement from around current prices(HL) to produce a new HH ,The most important resistances are highlighted
Best of wishes

GRTUSDTGRT ~ 1W ✅
#GRT Make purchases gradually after breaking through the resistance line of this descending pattern.


GRT hyper bullishJSE:GRT just breached the local downtrend resistance after a long consolidation.
Showing a great risk/reward. Adding here.

GRTUSDT – Here’s What You Need to Know!About The Graph (GRT): The Graph is a decentralized indexing protocol designed to query blockchain data effectively, similar to how search engines work for the web. This innovation is crucial for Web3 applications. With a market cap of $1.45 billion and 24-hour trading volume of $49 million, GRT is gaining attention among investors.
Impact of Rate Cuts: The Federal Reserve's recent 50 basis point rate cut is providing liquidity into riskier assets like altcoins, benefiting projects like GRT. Lower interest rates typically lead to greater risk appetite, and with GRT’s position in the Web3 ecosystem, it stands to gain in the coming months.
Good Entry Point: Currently, GRT is trading around $0.15, which presents a solid entry point, as it sits above key support levels. The primary support is at $0.095, while the immediate resistance is around $0.48. A breakout above this resistance could push GRT into a strong bullish run.
Technical Analysis:
📊 GRT is showing potential for a breakout with targets at:
Primary Objective: $0.75
Maximal Extension (Moonshot Target): $13.73
Support Levels: $0.095
Resistance Levels: $0.48 (initial), $1.73 (long-term)
This chart highlights the potential for GRT to rally if it breaks through its immediate resistance. With the favorable macroeconomic backdrop and solid fundamentals, this might be an ideal time to watch GRT closely. Watch for strong volume and a close above resistance to confirm the breakout.
One Love,
The FXPROFESSOR 💙
*If you like GRT, perhaps it’s also time to look into diversifying with AI + Crypto potential unicorns like CRGPT.

GRTUSDT 4H Touching the bottom - Double BottomGRTUSDT 4H Touching the bottom - Double Bottom
GRT is a necessary value for the development of dapps on different blockchains, so it has an intrinsic value.
Since March 2024, it has been falling gradually to the current area of 0.14
It is possible that in this area it has touched the bottom x 2 times and developed a minimum greater than the previous one. On the other hand, it is leaving the bearish channel that until now conditioned the price, so the probability of an upward change is imminent.
If BTC gives an upward push again, GRT will rise strongly.
If BTC corrects, up to 49K, GRT could correct a little more, but the feeling is that we have touched the bottom.
Levels:
SL1 - 0.1345
SL2 - 0.11
TP1 - 0.2175
TP2 - 0.3535
TP3 - 0.4945

#GRT Trend Reversal#GRT is currently breaking out of a 186-day downtrend and completed a double bottom on our daily support.
Next major resistance is at 0.2224


SHORT the GRT!I have a motto, after a flashy move, join it's golden pocket if given a chance before riding with the move
This is a CLEAR rejection of the old range POC. Why not short if it retraces its move to the upside?

GRTusdt trading opportunityGRTusdt currently presents a descending broadening wedge formation, with the price testing the upper trendline of this established setup. The recent rejection from this trendline signals a compelling opportunity for potential buybacks.
This strategic buyback opportunity is located within the designated buy zone, clearly depicted on the chart, with the placement of a stop loss to reduce risk.
Anticipation surrounds a strong rally in price movement following the breakthrough of the trendline, which could lead to a successful breach of the immediate resistance zone, as highlighted on the chart. This area serves as a significant level to watch, as the reaction here will dictate the coin's future movement.
The primary setup target, portrayed as a medium-term target, is visibly outlined on the chart.
Your feedback in the form of likes and comments is greatly appreciated.
Thank you.

GRT another short to be takenGRT has given the opportunity to replicate tha trade from my previous post. TP1 once again the POC same SL

GRT back into an old friend's rangeGRT enters previous range of value. Expecting a full rotation back to the VAL. TP1 @ POC, SL will be last 4H high @ 0.14725

The Graph Pre-2025 Bull-Market Accumulation Zone & StrategyIs ~8,500% truly possible for such a big project in 2025?
Good afternoon my friend, are you ready?
Let's review another chart, another altcoin project while at the same time considering how to best approach the cryptocurrency market and which actions we can take in order to improve our trading results.
Technical Analysis
The Graph has been in correction mode since March, its price remains relatively strong. GRTUSDT currently trades at the same price level as it traded back in January 2024.
The most relevant levels for this and other altcoin projects, as support, stand around October 2023 and November 2022 (this one), or June/July 2022 (most others).
A 50% drop would put The Graph at September/October 2023 prices, so we can safely assume that no new ATLs will be hit on this pair. This tells us also that the main bullish structure that was established thanks to the bullish wave that developed after the November 2022 low will remain valid; higher lows lead to higher highs.
This is all leading to our projection for a new All-Time High in 2025. Using the most simple method, which I learned through the books on Elliott Wave Theory by Robert R. Prechter Jr., an ATH of $7.56 becomes possible for this pair/chart. Using the accumulation zone price range as entry price, this would give us a total growth potential beyond 8,500%. Yes! I checked twice just to make sure I am not making a big blunder with these numbers. But, with that said, it wouldn't be that surprising knowing that many cryptos already produced such growth in late 2023 through early 2024; it would be only normal to expect this much and sometimes even more in the year 2025, when crypto will be more valuable and sought after than water in the dry deserts of the Sahara.
Trading Tips & Strategy
One of the biggest hurdle to overcome when holding patiently, is not knowing what to expect. When we buy an altcoin with the intention to hold long, when the unavoidable corrections and strong market shakeouts develop, we don't know what to expect and thus doubt can enter and make us wonder; should I continue holding or should I sell?
This is why a map is highly valuable and a great entry, priceless.
The map helps you develop a vision of the far distant future. With this vision in mind, you know that the cycle is not over the first time the market turns. Just as a correction is not over on the first low, in reverse, the bull-market will not be over on its first correction, it will go and go and go and it will seen to be going forever, as usual, surprising the majority of the players.
It doesn't matter if the ATH ends at $3, $5, $8 or $10. What matters is the early entry and a strategy to take profits along the way.
The great entry will also give you the confidence to hold each time a correction develops. There will be many corrections along the way. If you buy late, again, doubt quickly creeps in and you won't feel confident in holding, you will wonder; should I continue holding or should I sell?
If you think now what to do and how to approach the market when prices are going up, you won't have to decide in the moment and thus no uncertainty will cloud your mind. If you plan now for the year ahead, you are more likely to achieve trading success.
The strategy: Start planning. Write it down! Truly, think about it; What will you do? Really, and stick to it... Buy and hold.
Just prepare mentally because I will be here, screaming basically, "we've reach the top!"
And you will know when to sell.
Just don't fall victim to the mistake of reading and trusting this articles today, and once you are at the top with massive paper profits, saying things like, "No way, this guy must be crazy." It will be hard to sell, truly, but the only way to win is to buy at the bottom of the wave and selling at the top. Holding once the wave is over will only remove all those gains.
This is a mistake that we all have made. And that's not a problem, if a mistake is made we can own it and correct it for the next time, the next opportunity, the next pair.
I am writing for your entertainment.
Namaste.

Trade Setup: GRT Long PositionMarket Context:
GRT is currently breaking out of the top of its range support level, offering an opportunity for a potential long position if this breakout is confirmed.
Trade Setup:
Entry: Long trade between $0.15 and $0.16.
Take Profit:
First target: $0.20
Second target: $0.247
Stop Loss: Close under $0.1445.
📊 This setup takes advantage of the breakout opportunity while managing downside risk with a tight stop loss. Keep an eye on the breakout confirmation for a solid entry. #GRT #CryptoTrading #Breakout

GRT is probably to be short!!GRT can start a bearish movement against its rising trendline. Also, here we have a supply block that can strengthen this idea .

papicoin long term strategy for the graph $grtblessings to all sisters and brothers who search and work for consciousness, love and freedom.
for you who understand what is going on and see on crypto the opportunity to empower decentralized communities for decentralized power and wealth, i am glad to share my long term strategy on theses cryptos that I am willing to accumulate and hodl.
the green areas are the ones I will use to but and accumulate, the lower the prices the more amount of capital, of course.
in the blue areas I will be taking some profits, the higher the price the more I will distribute.
feel free to ask anything, i would be glad to answer, but I do not promise immediate responses, lol.
keep connecting to the vibrations and elevating the frecuencies for the human awakening by meditating, praying, celebrating and being the origin of love and harmony!

GRTUSDT ANALYSISPAIR : BYBIT:GRTUSDT.P
Leverage: 5X
Direction: LONG 🔼
SL: HODL
TP: 0.18500
ANALYSIS:
Market Cypher B: 1D TF✅
Bull Bear Power: 3HR TF✅
Nearest Resistance: 0.18500
Nearest Support: 0.13500
⚠️#DYOR

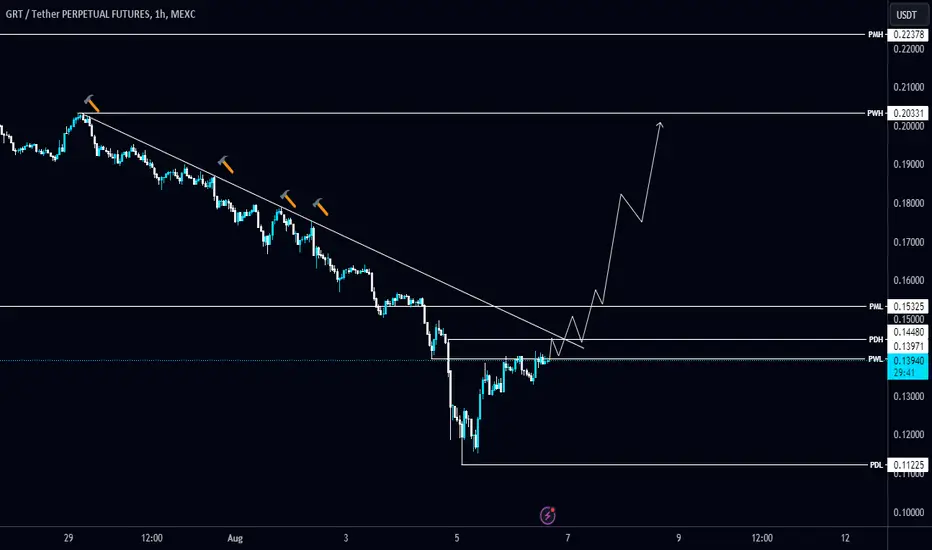
#GRT/USDT is heading towards the Diagonal Trendline in 1-Hour TF#GRT/USDT is heading towards the Diagonal Trendline in 1-Hour TF!
JSE:GRT will be bullish if it breaks the Diagonal Trendline. #GRTUSDT is trying to reclaim PWL $0.1397 as a support level, the resistance level is PML $0.15325.