Altseason 2025 - Wave 3Bitcoin is approaching its next destination between $125K and $250K, and that means its time to shift focus to altcoins. We’re not in full-blown altseason yet, but the foundations are forming. BTC dominance needs to drop fast, that’s the key trigger. Once it does, the rotation into alts could accele
Related pairs

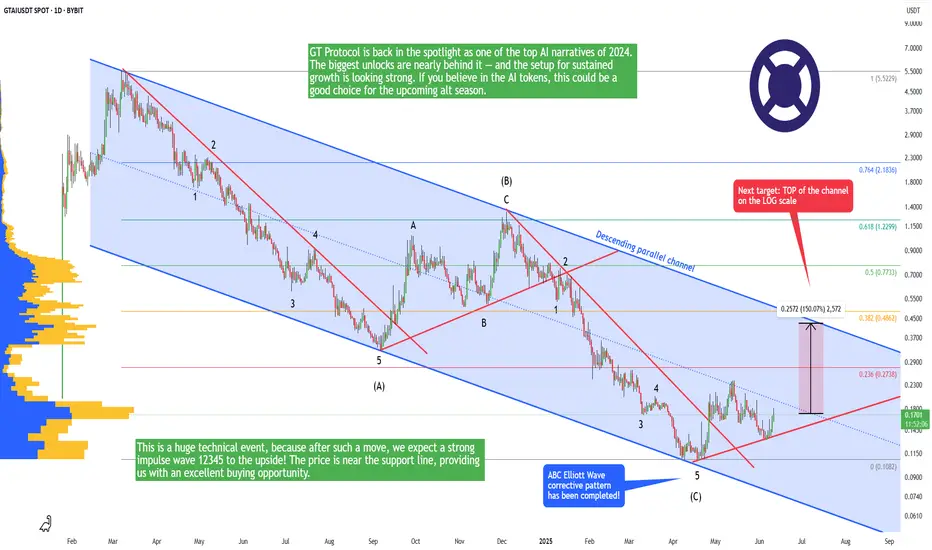
GTAI - Time to buy this altcoin! (bottom is in)GTAI (GT Protocol) is a relatively new altcoin that is listed on major exchanges. On CoinMarketCap, this altcoin has a rank of #1121, which means it has a lot of room to go to the upside. You probably don't want to buy some famous altcoins in the TOP section because there is no 100x potential anymor
GT Protocol ($GTAI) | Breakout Loading? +500% Potential! (READ)By analyzing the #GTProtocol chart on the daily (logarithmic) timeframe, we can see that the price was forming a solid base between $0.12 and $0.15. Currently trading around $0.17, the chart structure remains bullish and primed for a potential breakout. Momentum is gradually building, and I expect t

#GTAI/USDT#GTAI
The price is moving within a descending channel on the 1-hour frame, adhering well to it, and is heading for a strong breakout and retest.
We are seeing a bounce from the lower boundary of the descending channel, which is support at 0.1844
We have a downtrend on the RSI indicator that is abo

GT Protocol (GTAI)GT Protocol is one of the new member in the group of AI coins. They say that GT Protocol's robust ecosystem merges an investment protocol for decentralized Web3 funds management with Blockchain AI Execution Technology.
Anyway, GTAI chart is young and few candles are there to analyze. But, GTAI's ch

GTAI's Situation: What Shall we Expect !!!GTAI is moving inside a symmetrical triangle on hourly time frame. So the Possible scenarios is If the price dumps and breaks down of the triangle, we can see bearish momentum in it.
Stay tuned with us for further updates✔️
✨We spend hours finding potential opportunities and writing useful ideas, w

GTAIUSDT can ascend further ! What Shall we Expect ?We have a Bullish Structure here
Adam & Eve pattern is completed and now we testing the resistance cluster of Descending Resistance + A&E neckline + 1$ Key Zone☝️
Looking for a breakout and rally📈
✅ Due to the Ascending structure of the chart...
🟢 High potential areas are clear in the chart.
🟢 Adam

GTAIUSDT Mid term Road MapThe price is in a megaphone, and now the price is on the bottom of Megaphone, and this means that the price can grow to the top of the megaphone. Also bullish divergence increases the chance of this signal.
✨Traders, if you liked this idea or have your opinion on it, write in the comments, We will

GTAI's Situation: What Shall we Expect !!!COINEX:GTAIUSDT
GTAI is forming a falling wedge on 4h timeframe , Up we go if we do breakout.
🔵We have a Bullish Structure here
GTAI formed a falling wedge on 4h timeframe🤔
Up we go if we do breakout , also a bullish Divergence (RD+) on MACD which shows Positive Signs for GTAI.
✅ Due to the Asce

(Update) !!! 4h Chart Analysis (READ)Hi.
MEXC:GTAUSDT
Today, I want to analyze GTAI for you in a 4h time frame so that we can have a SHORT-term view of GTAI regarding the technical analysis. (Please ✌️respectfully✌️share if you have a different opinion from me or other analysts).
🔵We have a Bullish Structure here
GTAI formed a

See all ideas
Summarizing what the indicators are suggesting.
Oscillators
Neutral
SellBuy
Strong sellStrong buy
Strong sellSellNeutralBuyStrong buy
Oscillators
Neutral
SellBuy
Strong sellStrong buy
Strong sellSellNeutralBuyStrong buy
Summary
Neutral
SellBuy
Strong sellStrong buy
Strong sellSellNeutralBuyStrong buy
Summary
Neutral
SellBuy
Strong sellStrong buy
Strong sellSellNeutralBuyStrong buy
Summary
Neutral
SellBuy
Strong sellStrong buy
Strong sellSellNeutralBuyStrong buy
Moving Averages
Neutral
SellBuy
Strong sellStrong buy
Strong sellSellNeutralBuyStrong buy
Moving Averages
Neutral
SellBuy
Strong sellStrong buy
Strong sellSellNeutralBuyStrong buy
Displays a symbol's price movements over previous years to identify recurring trends.
Frequently Asked Questions
The current price of GTAI / Tether USD (GTAI) is 0.1472 USDT — it has fallen −0.67% in the past 24 hours. Try placing this info into the context by checking out what coins are also gaining and losing at the moment and seeing GTAI price chart.
GTAI / Tether USD price has fallen by −4.53% over the last week, its month performance shows a −9.12% decrease, and as for the last year, GTAI / Tether USD has decreased by −76.89%. See more dynamics on GTAI price chart.
Keep track of coins' changes with our Crypto Coins Heatmap.
Keep track of coins' changes with our Crypto Coins Heatmap.
GTAI / Tether USD (GTAI) reached its highest price on Mar 10, 2024 — it amounted to 5.4995 USDT. Find more insights on the GTAI price chart.
See the list of crypto gainers and choose what best fits your strategy.
See the list of crypto gainers and choose what best fits your strategy.
GTAI / Tether USD (GTAI) reached the lowest price of 0.0500 USDT on Jan 25, 2024. View more GTAI / Tether USD dynamics on the price chart.
See the list of crypto losers to find unexpected opportunities.
See the list of crypto losers to find unexpected opportunities.
The safest choice when buying GTAI is to go to a well-known crypto exchange. Some of the popular names are Binance, Coinbase, Kraken. But you'll have to find a reliable broker and create an account first. You can trade GTAI right from TradingView charts — just choose a broker and connect to your account.
Crypto markets are famous for their volatility, so one should study all the available stats before adding crypto assets to their portfolio. Very often it's technical analysis that comes in handy. We prepared technical ratings for GTAI / Tether USD (GTAI): today its technical analysis shows the sell signal, and according to the 1 week rating GTAI shows the sell signal. And you'd better dig deeper and study 1 month rating too — it's neutral. Find inspiration in GTAI / Tether USD trading ideas and keep track of what's moving crypto markets with our crypto news feed.
GTAI / Tether USD (GTAI) is just as reliable as any other crypto asset — this corner of the world market is highly volatile. Today, for instance, GTAI / Tether USD is estimated as 3.71% volatile. The only thing it means is that you must prepare and examine all available information before making a decision. And if you're not sure about GTAI / Tether USD, you can find more inspiration in our curated watchlists.
You can discuss GTAI / Tether USD (GTAI) with other users in our public chats, Minds or in the comments to Ideas.