Altseason 2025 - Wave 3Bitcoin is approaching its next destination between $125K and $250K, and that means its time to shift focus to altcoins. We’re not in full-blown altseason yet, but the foundations are forming. BTC dominance needs to drop fast, that’s the key trigger. Once it does, the rotation into alts could accelerate quickly.
Favorites so far this cycle:
🥑 POLONIEX:GUACUSDT 🧱 MEXC:YBRUSDT ⛏️ MEXC:KLSUSDT
🌐 HTX:SYNTUSDT 🧪 POLONIEX:DEAIUSDT *⃣ MEXC:SAIUSDT
🔗 POLONIEX:LLUSDT 🎮 KUCOIN:MYRIAUSDT 🤖 COINEX:ENQAIUSDT
GTAIUSDT trade ideas

GTAI - Time to buy this altcoin! (bottom is in)GTAI (GT Protocol) is a relatively new altcoin that is listed on major exchanges. On CoinMarketCap, this altcoin has a rank of #1121, which means it has a lot of room to go to the upside. You probably don't want to buy some famous altcoins in the TOP section because there is no 100x potential anymore. But if you want a reliable but small profit, then you can go with BTC or other major altcoins.
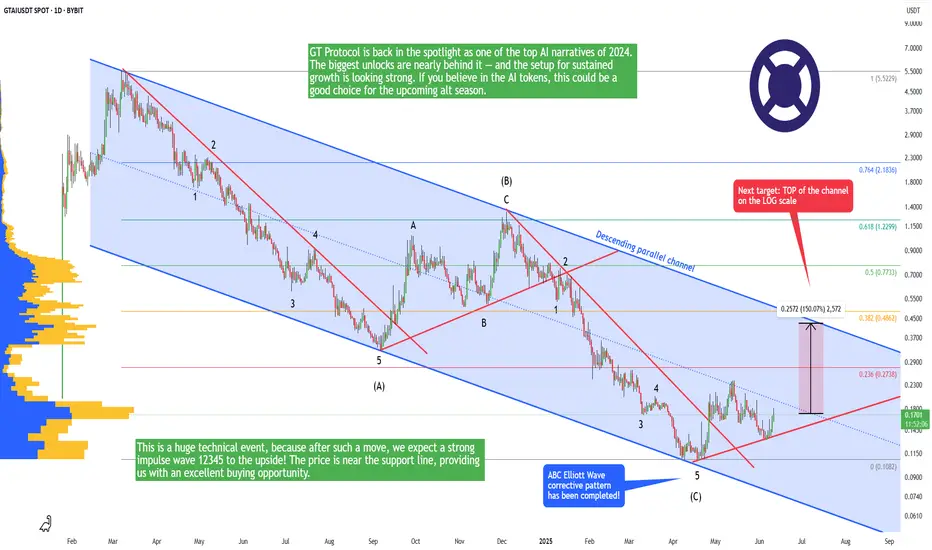
GT Protocol is back in the spotlight as one of the top AI narratives of 2024. The biggest unlocks are nearly behind it — and the setup for sustained growth is looking strong. If you believe in the AI tokens, this could be a good choice for the upcoming alt season.
From a technical point of view, this altcoin just completed a major ABC corrective wave on the weekly timeframe. This is a huge technical event, because after such a move, we expect a strong impulse wave 12345 to the upside! Currently, the price has been trending in this blue descending parallel channel. The price is near the support line, providing us with an excellent buying opportunity.
I expect GTAI to go up in the immediate short term and mid-term because the price should retest the downward-sloping trendline of the channel. Now it's up to you if you take a 150% profit or hold for the long term! Let me know in the comment section what you think about this altcoin? Trading is not hard if you have a good coach! This is not a trade setup, as there is no stop-loss or profit target. I share my trades privately. Thank you, and I wish you successful trades!
GT Protocol ($GTAI) | Breakout Loading? +500% Potential! (READ)By analyzing the #GTProtocol chart on the daily (logarithmic) timeframe, we can see that the price was forming a solid base between $0.12 and $0.15. Currently trading around $0.17, the chart structure remains bullish and primed for a potential breakout. Momentum is gradually building, and I expect the price to soon test the $0.185 level, followed by short-term targets at $0.20, $0.24, and $0.266.
In the long run, my bullish bias remains firm with targets at $0.37, $0.45, and a psychological milestone of $1.00, representing a potential upside of over 500% from current levels!
Fundamental Drivers Supporting the Move
• Tokenomics: Recent unlocks have distributed supply more evenly, easing early-seller pressure and improving liquidity dynamics.
• Utility & Adoption: As a Web3 AI-execution layer, GT Protocol is expanding its real-world use cases with new partnerships and integrations.
• Narrative Strength: Positioned as a leading AI narrative for 2024, $GTAI is gaining traction amid rising AI sector demand.
Sentiment & On-chain Signals
• Community Hype: Activity on X (Twitter) and Telegram is surging, with bullish sentiment dominating conversations since the recent breakout attempt.
• Social Volume: A spike in daily mentions suggests increasing retail attention—often a precursor to strong moves.
• Whale Accumulation: Smart money has been seen accumulating below current levels—an early sign of confidence in the next leg up.
With both the technical setup and fundamentals aligning, $GTAI looks ready for an explosive run. Keep it on your radar!
Please support me with your likes and comments to motivate me to share more analysis with you and share your opinion about the possible trend of this chart with me !
Best Regards , Arman Shaban

#GTAI/USDT#GTAI
The price is moving within a descending channel on the 1-hour frame, adhering well to it, and is heading for a strong breakout and retest.
We are seeing a bounce from the lower boundary of the descending channel, which is support at 0.1844
We have a downtrend on the RSI indicator that is about to be broken and retested, supporting the upward trend.
We are looking for stability above the 100 Moving Average.
Entry price: 0.1850
First target: 0.1870
Second target: 0.1895
Third target: 0.1918

GT Protocol (GTAI)GT Protocol is one of the new member in the group of AI coins. They say that GT Protocol's robust ecosystem merges an investment protocol for decentralized Web3 funds management with Blockchain AI Execution Technology.
Anyway, GTAI chart is young and few candles are there to analyze. But, GTAI's chart seems promising. Let's see what happens.

GTAI's Situation: What Shall we Expect !!!GTAI is moving inside a symmetrical triangle on hourly time frame. So the Possible scenarios is If the price dumps and breaks down of the triangle, we can see bearish momentum in it.
Stay tuned with us for further updates✔️
✨We spend hours finding potential opportunities and writing useful ideas, we would be happy if you support us.
Best regards CobraVanguard.💚
_ _ _ _ __ _ _ _ _ _ _ _ _ _ _ _ _ _ _ _ _ _ _ _ _ _ _ _ _ _ _ _
✅Thank you, and for more ideas, hit ❤️Like❤️ and 🌟Follow🌟!
⚠️Things can change...
The markets are always changing and even with all these signals, the market changes tend to be strong and fast!!

GTAIUSDT can ascend further ! What Shall we Expect ?We have a Bullish Structure here
Adam & Eve pattern is completed and now we testing the resistance cluster of Descending Resistance + A&E neckline + 1$ Key Zone☝️
Looking for a breakout and rally📈
✅ Due to the Ascending structure of the chart...
🟢 High potential areas are clear in the chart.
🟢 Adam & Eve pattern.
🟢 AB=CD.
✨We spend hours finding potential opportunities and writing useful ideas, we would be happy if you support us.
Best regards CobraVanguard.💚
_ _ _ _ __ _ _ _ _ _ _ _ _ _ _ _ _ _ _ _ _ _ _ _ _ _ _ _ _ _ _ _
✅Thank you, and for more ideas, hit ❤️Like❤️ and 🌟Follow🌟!
⚠️Things can change...
The markets are always changing and even with all these signals, the market changes tend to be strong and fast!!

GTAIUSDT Mid term Road MapThe price is in a megaphone, and now the price is on the bottom of Megaphone, and this means that the price can grow to the top of the megaphone. Also bullish divergence increases the chance of this signal.
✨Traders, if you liked this idea or have your opinion on it, write in the comments, We will be glad.
_ _ _ _ __ _ _ _ _ _ _ _ _ _ _ _ _ _ _ _ _ _ _ _ _ _ _ _ _ _ _ _
✅Thank you, and for more ideas, hit ❤️Like❤️ and 🌟Follow🌟!
⚠️Things can change...
The markets are always changing and even with all these signals, the market changes tend to be strong and fast!!

GTAI's Situation: What Shall we Expect !!!COINEX:GTAIUSDT
GTAI is forming a falling wedge on 4h timeframe , Up we go if we do breakout.
🔵We have a Bullish Structure here
GTAI formed a falling wedge on 4h timeframe🤔
Up we go if we do breakout , also a bullish Divergence (RD+) on MACD which shows Positive Signs for GTAI.
✅ Due to the Ascending structure of the chart...
🟢 High potential areas are clear in the chart.
🟢 Bullish Wedge.
🟢 5th waves.
🟢Bullish Regular Divergence(+RD)
✨Traders, if you liked this idea or have your opinion on it, write in the comments, We will be glad.
_ _ _ _ __ _ _ _ _ _ _ _ _ _ _ _ _ _ _ _ _ _ _ _ _ _ _ _ _ _ _ _
✅Thank you, and for more ideas, hit ❤️Like❤️ and 🌟Follow🌟!
⚠️Things can change...
The markets are always changing and even with all these signals, the market changes tend to be strong and fast!

(Update) !!! 4h Chart Analysis (READ)Hi.
MEXC:GTAUSDT
Today, I want to analyze GTAI for you in a 4h time frame so that we can have a SHORT-term view of GTAI regarding the technical analysis. (Please ✌️respectfully✌️share if you have a different opinion from me or other analysts).
🔵We have a Bullish Structure here
GTAI formed a falling wedge on 4h timeframe🤔
Up we go if we do breakout , also a bullish Divergence (RD+) on MACD which shows Positive Signs for GTAI.
✅ Due to the Ascending structure of the chart...
🟢 High potential areas are clear in the chart.
🟢 Bullish Wedge.
🟢 5th waves.
🟢Bullish Regular Divergence(+RD)
✨Traders, if you liked this idea or have your opinion on it, write in the comments, We will be glad.
_ _ _ _ __ _ _ _ _ _ _ _ _ _ _ _ _ _ _ _ _ _ _ _ _ _ _ _ _ _ _ _
✅Thank you, and for more ideas, hit ❤️Like❤️ and 🌟Follow🌟!
⚠️Things can change...
The markets are always changing and even with all these signals, the market changes tend to be strong and fast!

GTAI/USDT : Another Bullrun Ahead ? (READ THE CAPTION)By analyzing the #GTProtocol chart on the 4-hour timeframe, we observe that, as expected from our previous analysis, this cryptocurrency has grown by 13% to reach $0.5620! Now, after a correction that brought GT Protocol down to the $0.48 level, we see support at this range. If the price can stabilize above the support zone of $0.45 to $0.48, we can anticipate further growth from this cryptocurrency! The expected short-term return is 9%, and the mid-term return is 45%.
Please support me with your likes and comments to motivate me to share more analysis with you and share your opinion about the possible trend of this chart with me !
Best Regards , Arman Shaban

NOTHING !!KUCOIN:GTAIUSDT
The price is in a megaphone, and now the price is on the bottom of Megaphone, and this means that the price can grow to the top of the megaphone. Also bullish divergence increases the chance of this signal.
✨Traders, if you liked this idea or have your opinion on it, write in the comments, We will be glad.
_ _ _ _ __ _ _ _ _ _ _ _ _ _ _ _ _ _ _ _ _ _ _ _ _ _ _ _ _ _ _ _
✅Thank you, and for more ideas, hit ❤️Like❤️ and 🌟Follow🌟!
⚠️Things can change...
The markets are always changing and even with all these signals, the market changes tend to be strong and fast!!

GTAU/USDT : Waiting for Consolidation ! (READ THE CAPTION)By examining the GT Protocol chart in the 4-hour timeframe, we observe that after the entire cryptocurrency market experienced a significant drop last week, this cryptocurrency was no exception and corrected down to $0.45. Currently, GT Protocol is trading around $0.51, and we need to see whether it can stabilize within the $0.45 to $0.49 range this week. This analysis will be updated.
Please support me with your likes and comments to motivate me to share more analysis with you and share your opinion about the possible trend of this chart with me !
Best Regards , Arman Shaban

GTAIUSDT 6-Hour Chart Analysis : Bull or Bear ? (READ)KUCOIN:GTAIUSDT
The price is in a megaphone, and now the price is on the bottom of Megaphone, and this means that the price can grow to the top of the megaphone.
The situation now
Overall Trend: The overall trend for the GTAI/USDT pair is currently neutral, with no strong buy or sell signals.
Moving Averages: The moving averages are also showing a neutral stance, indicating that the price is neither strongly trending upwards nor downwards.
Oscillators: Key oscillators like the Relative Strength Index (RSI) and MACD are also neutral, suggesting a lack of momentum in either direction.
✨Traders, if you liked this idea or have your opinion on it, write in the comments, We will be glad.
_ _ _ _ __ _ _ _ _ _ _ _ _ _ _ _ _ _ _ _ _ _ _ _ _ _ _ _ _ _ _ _
✅Thank you, and for more ideas, hit ❤️Like❤️ and 🌟Follow🌟!
⚠️Things can change...
The markets are always changing and even with all these signals, the market changes tend to be strong and fast!!

GTAI/USDT : Bull or Bear ? (READ THE CAPTION)Analyzing the #GT_Protocol chart on the 4-hour timeframe, we can see that, as expected, this cryptocurrency has moved upward twice since our analysis. The first move recorded a return of 16%, and the second move, after entering the demand zone at $0.64, resulted in another 11% return. In total, the return on this analysis from last week to today has exceeded 27%! This analysis remains valid. (This Analysis Will be Updated)
Please support me with your likes and comments to motivate me to share more analysis with you and share your opinion about the possible trend of this chart with me !
Best Regards , Arman Shaban

GTAIUSDT Trade ideaGTAIUSDT is in a freefall, continuing towards our projected drop target of the 61.8% Fibonacci retracement level of the entire rally around 0.7 to 0.6 range. This key Fibonacci level serves as a potential accumulation point, offering an attractive buying opportunity.
We expect a reversal or stabilization around this level, as indicated by the potential path outlined on the chart. Monitoring price action closely at this critical support zone will be crucial for timing re-entry and maximizing potential gains.

Are you Ready ?!!!POLONIEX:GTAIUSDT
We expect the price to correct a little more and then reach higher with the channel breaking.
And if that happens, you won't see these low prices again.
✨Traders, if you liked this idea or have your opinion on it, write in the comments, We will be glad.
_ _ _ _ __ _ _ _ _ _ _ _ _ _ _ _ _ _ _ _ _ _ _ _ _ _ _ _ _ _ _ _
✅Thank you, and for more ideas, hit ❤️Like❤️ and 🌟Follow🌟!
⚠️Things can change...
The markets are always changing and even with all these signals, the market changes tend to be strong and fast!!

GTAIUSDT (Crypto)🏦 #GTAIUSDT (GT Protocol)
🕓 Time Frame : 4H
🔼 Status : Bullish
📆 26/07/2024
Overview :
Let's dive into another analysis of #GTProtocol! The price moved exactly as expected, rising from the identified demand zone and achieving a solid 25% growth, hitting the target at $0.91 where the liquidity pool was located. This was followed by a price correction. Over the past two weeks, this analysis has yielded a total return of over 65%.
Key Observations:
Initial Rise: The price rose from the demand zone and achieved 25% growth, reaching $0.91.
Correction: After hitting the target, the price experienced a correction.
Current Market Situation:
Demand Zone: The price has returned to the demand zone between $0.63 and $0.67.
Stabilization: If the price stabilizes above this crucial level, another upward move is anticipated.
Forecast :
Short-Term Return: Expected return of 40%.
Medium-Term Return: Potential to exceed 70%.
Conclusion :
GTProtocol's price action has followed the expected path, achieving significant gains. With the price back in the demand zone, the potential for further growth remains strong if stabilization occurs above the $0.63 to $0.67 range.
Keep an eye on the 7400 level, it may cause stress :)

GTAI/USDT : Keep an eye on this Demand Zone (READ THE CAPTION)Alright, let's dive into another analysis of #GTProtocol ! As you can see, the price moved exactly as expected. It started to rise from the demand zone I had identified and achieved a solid 25% growth, hitting the target at $0.91 where the liquidity pool was located. This was followed by a price correction. Over the past two weeks, this analysis has yielded a total return of over 65%! Now, the price has returned to the demand zone between $0.63 and $0.67. If it stabilizes above this crucial level, we can anticipate another upward move. The expected short-term return is 40%, and in the medium term, it could exceed 70%!
Please support me with your likes and comments to motivate me to share more analysis with you and share your opinion about the possible trend of this chart with me !
Best Regards , Arman Shaban

I Cannot Short This !!! situation+next targets.The price has reached the top of the channel and now needs a small correction. After that we expect the price to break this channel and rise.
✨Traders, if you liked this idea or have your opinion on it, write in the comments, We will be glad.
_ _ _ _ __ _ _ _ _ _ _ _ _ _ _ _ _ _ _ _ _ _ _ _ _ _ _ _ _ _ _ _
✅Thank you, and for more ideas, hit ❤️Like❤️ and 🌟Follow🌟!
⚠️Things can change...
The markets are always changing and even with all these signals, the market changes tend to be strong and fast!!

GTAI/USDT : More Bullish Move Ahead ? (READ THE CAPTION)By examining the GT Protocol cryptocurrency chart, we see that, as expected, the price maintained the support level in the specified range and achieved over a 40% increase in less than a week, reaching $0.90. Currently, GT is trading around $0.75, and if it holds the support range of $0.71 to $0.75, we can anticipate further growth to higher levels. I hope you made the most of this exciting analysis!
Please support me with your likes and comments to motivate me to share more analysis with you and share your opinion about the possible trend of this chart with me !
Best Regards , Arman Shaban

The road to 1$KUCOIN:GTAIUSDT
Finally GTAI broken the Falling Wedge It means Price Can rise up well.
✨Traders, if you liked this idea or have your opinion on it, write in the comments, We will be glad.
_ _ _ _ __ _ _ _ _ _ _ _ _ _ _ _ _ _ _ _ _ _ _ _ _ _ _ _ _ _ _ _
✅Thank you, and for more ideas, hit ❤️Like❤️ and 🌟Follow🌟!
⚠️Things can change...
The markets are always changing and even with all these signals, the market changes tend to be strong and fast!!

GTAI/USDT - Ready for another Rise ? (READ THE CAPTION)By analyzing the GT Protocol chart on the 2-hour timeframe, we observe that the price is currently consolidating around 68 cents. If it manages to maintain support in the range of 59 to 66 cents, we could potentially see further growth in this cryptocurrency! The next probable liquidity pool targets are indicated on the chart.
Please support me with your likes and comments to motivate me to share more analysis with you and share your opinion about the possible trend of this chart with me !
Best Regards , Arman Shaban
