Related pairs

The perfect setup A+ (short)This is the perfect setup for a short position in my book, overall trend is a downtrend on the Daily time frame, it has been constantly going down and it’s showing more downside since it did a pullback creating a bear flag, which it has broke out of the flag and it’s retesting, this trade is offerin

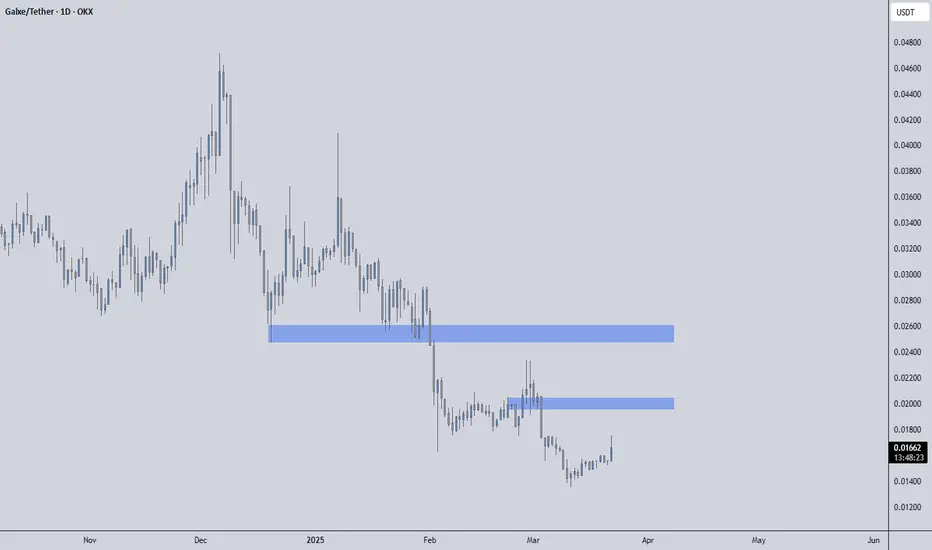
GUSDT – Blue Boxes Mark the Resistance Zones! “We're at a critical level—can buyers push through or will resistance hold?”
🔥 Key Insights:
✅ Blue Boxes = Resistance Zones – Expect strong reactions here.
✅ Rejection = Short Setup – But only with LTF breakdown confirmation.
💡 The Smart Plan:
Watch Lower Time Frames (15M & 1H) – Look for br
Simple Scalping short $GThis is only simple set up , only using tf 15minute , already mss , and at 4h we are already testing Supply zone. 1:3r here , DYOR.

G Flying?Gravity is going superb after our Buy print. Next stop at 0.04 area. Volume is massive.
DyOR
For early and entry and cut big stoploss, you can try our indicator.
Drop a message to know more.

G/USDT LONG TRADE SETUP !!This is a long trade setup for G/USDT with specific entry, stop-loss, target, and leverage details:
Entry: Current Market Price (CMP) and $0.03090
Stop-Loss: $0.03000
Target: $0.03678
Leverage: 5x to 10x
Let me know if you’d like further assistance or adjustments!
DYOR. NFA

Strategic Buy Opportunity in Cryptocurrency GDescription:
Unlock the potential of Cryptocurrency G with a strategic buy approach grounded in fundamental analysis. This guide offers key insights into the factors that can influence the value of Crypto G, helping you make informed trading decisions on TradingView.
Fundamentals Overview:
1. **A

#G/USDT is heading towards the Diagonal Trendline in 1-hour TF!#G/USDT is heading towards the Diagonal Trendline in 1-hour TF!
Wait for BO/retest to long $G. The local resistance level is PDH $0.04328 and the support level is PDL $0.03945.

G (Gravity) holding Strong !Gravity like many other coins - may just hit bottom. Not a financial advice.
But for any upside targets. There they are.
For any downside DCA targets.. leave a comment! Take care !

G/USDT NEW ATH POSSIBLITYThe last data shows that G/USDT has a good chance to create a new volume in the coming time frames, we will follow up to see if this coin is able to have confirmation in the coming time frames.
G/USD has a history of breakdown trends, we will follow the coin to see if this is the reversal trend.
T

See all ideas
Summarizing what the indicators are suggesting.
Oscillators
Neutral
SellBuy
Strong sellStrong buy
Strong sellSellNeutralBuyStrong buy
Oscillators
Neutral
SellBuy
Strong sellStrong buy
Strong sellSellNeutralBuyStrong buy
Summary
Neutral
SellBuy
Strong sellStrong buy
Strong sellSellNeutralBuyStrong buy
Summary
Neutral
SellBuy
Strong sellStrong buy
Strong sellSellNeutralBuyStrong buy
Summary
Neutral
SellBuy
Strong sellStrong buy
Strong sellSellNeutralBuyStrong buy
Moving Averages
Neutral
SellBuy
Strong sellStrong buy
Strong sellSellNeutralBuyStrong buy
Moving Averages
Neutral
SellBuy
Strong sellStrong buy
Strong sellSellNeutralBuyStrong buy
Displays a symbol's price movements over previous years to identify recurring trends.
Frequently Asked Questions
The current price of GUSDT SPOT (G) is 0.01397 USDT — it has risen 1.41% in the past 24 hours. Try placing this info into the context by checking out what coins are also gaining and losing at the moment and seeing G price chart.
GUSDT SPOT price has risen by 2.25% over the last week, its month performance shows a 23.08% increase, and as for the last year, GUSDT SPOT has decreased by −33.48%. See more dynamics on G price chart.
Keep track of coins' changes with our Crypto Coins Heatmap.
Keep track of coins' changes with our Crypto Coins Heatmap.
GUSDT SPOT (G) reached its highest price on Dec 6, 2024 — it amounted to 0.04715 USDT. Find more insights on the G price chart.
See the list of crypto gainers and choose what best fits your strategy.
See the list of crypto gainers and choose what best fits your strategy.
GUSDT SPOT (G) reached the lowest price of 0.00986 USDT on Jun 22, 2025. View more GUSDT SPOT dynamics on the price chart.
See the list of crypto losers to find unexpected opportunities.
See the list of crypto losers to find unexpected opportunities.
The safest choice when buying G is to go to a well-known crypto exchange. Some of the popular names are Binance, Coinbase, Kraken. But you'll have to find a reliable broker and create an account first. You can trade G right from TradingView charts — just choose a broker and connect to your account.
Crypto markets are famous for their volatility, so one should study all the available stats before adding crypto assets to their portfolio. Very often it's technical analysis that comes in handy. We prepared technical ratings for GUSDT SPOT (G): today its technical analysis shows the buy signal, and according to the 1 week rating G shows the neutral signal. And you'd better dig deeper and study 1 month rating too — it's buy. Find inspiration in GUSDT SPOT trading ideas and keep track of what's moving crypto markets with our crypto news feed.
GUSDT SPOT (G) is just as reliable as any other crypto asset — this corner of the world market is highly volatile. Today, for instance, GUSDT SPOT is estimated as 4.80% volatile. The only thing it means is that you must prepare and examine all available information before making a decision. And if you're not sure about GUSDT SPOT, you can find more inspiration in our curated watchlists.
You can discuss GUSDT SPOT (G) with other users in our public chats, Minds or in the comments to Ideas.