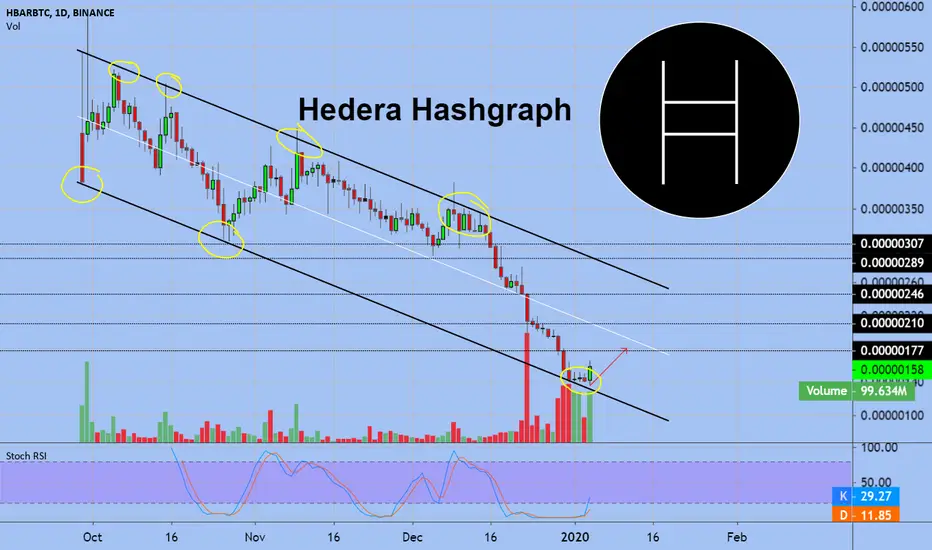
HBAR HAS MORE ROOM TO PUMPHbar has a lot more room to grow. We broke out of the black downtrend, accumulated and have now broken out. 196 is first target. Id buy dips all the way down to the top of the accumulation zone.
HBARBTC trade ideas


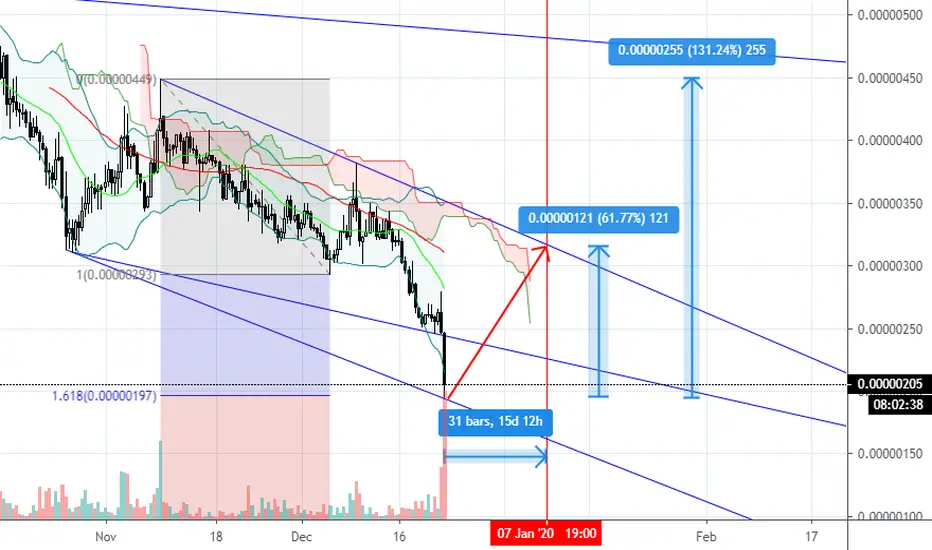
HBAR/BTC 1D (Binance) Broke-out of falling wedgeHedera Hashgraph is looking quite good for mid-term after this breakout and pullback.
The road to last triangle support (became resistance) is just starting, set-up:
Entry= 0.00000127 - 0.00000135
Take Profit= 0.00000163 - 0.00000195 - 0.0000259
Stop Loss= 0.00000099 or below
Risk/Reward Ratio= 1:1 - 1:2 - 1:4


HBAR/BTC | Descending Channel !!HBAR/BTC (Update)
Forming Lower Lows in DAILY Chart From Long time & Now Buying Volume is Increasing .
RSI & MACD Both Are Turing Bullish as well. Moving Below the Daily EMA10, If Broken it then Chances of Uptrend Will Increase.
Key Resistance/Breakout Zone : 237 Sats
Please like, subscribe and share your ideas and charts with the community!

Hedera HashgraphHBARBTC moving in downtrend channel.We touched support line of this channel and I see volume is coming. We can reach midle line of this channel

HBAR / BTC DAILY SHOW'S SOME POTENTIAL REVERSAL SIGNSHBAR, THIS COIN IS NOT TRADING A LONG TIME BUT LET'S SEE:
* Big volume now the last candles cloud set the price bottom here but be carefull
* RSI is curving up now.
* MACD MA's Show bearish momentum is weakening.
* Also big bullish Devergence
LEt's see....


HBARBTC 1DDowntrend channel
EOY distribution ( www.hedera.com )
Entry zone: 150-160 sats
Take profit: 225-240 sats

HBAR / BTC DAILYHBAR on the Daily. Potential Reversal signs, this is what i see:
* RSI just don't shoot through the bottom of the monitor, very very oversold!
* Big bullish devergence also
* MACD MA'S tries to switch bullish.
* Riding on low volume!
Take an eye on this one next days mates!


Are you ready to buy the dip one more time? HBARBTCI'll buy it at 204 sats, STOP-LOSS 1D candle close below it.

Hedera Hashgraph (Dec 23) - 65% in 16 Days, Max 130%#HBAR/BTC (Binance)
Entry Zone: 200 - 205
Take Profits: 215 - 230 - 250 - 300 - 350 - 400 - 450
Stop Loss: 184
HBARBINANCE:HBARBTC I been waiting for this company to put their coin in the exchanges.
Right now BINANCE:HBARBTC is in a wedge pattern and the BB bands are squeezing telling us a big move is around the corner. I will likely wait for that move to happen before I buy.
My suggestion is to keep a close eye on this coin, place you alerts.
patience is key.

HBARBTC formed bullish Butterfly | Upto 47% bullish movePrice action of Hedera Hashgraph / Bitcoin has formed a bullish Butterfly and entered in potential reversal zone.
This PRZ area should be used as stop loss in case of complete candle stick closed below this area.
I have used Fibonacci sequence to set the targets:
Buy between: 0.00000269 to 0.00000238
Sell between: 0.00000293 to 0.00000351
Regards,
Atif Akbar (moon333)

HBAR / BTC Downlink formed. Step 40%. Pivot PointsAfter breaking through support, a downward channel looms in 40% increments.
Trading within the channel from trend lines that act as support / resistance.
Pivot points (zones) and targets on the chart.
A break of the channel and price fixing above the downtrend line (red) will mean a trend reversal. The coin is new, there was no pumping.
Stop loss
Under key support levels during your entry into the market.


HBAR/BTC (Update) | Getting Ready For Big Move..!!HBAR/BTC (Update)
Forming Falling Wedge in Daily TF Chart But Need Some Strong Buying Volume For Breakout..
In Case of Breakout, It Might Test 400-420 Sats Region..
If Failed to Break then Expecting Another Lower Low inside the Wedge..
Keep Your Eyes on it..!!
Please, give us your opinion in the comments.!!
If you like the idea, please hit the Like button and subscribe to the profile in order not to miss our updates.
The information given is never financial advice. Always do your own research.

HBAR Double bottom. There was no pumping! Price pivot points.Young coin. The first trading on the exchange began in September . Satoshi price, therefore it is easy to pump up and keep the price, a lot of coins. People are not afraid to buy cheap, believing that it will greatly grow. Made only for making real money temporarily, on those people who believe in a legend and perspective.
The coin has not yet rocked ! !! This is the main argument in favor of growth. In a downtrend, a double bottom forms.
All points of price reversals and targets showed on the chart. I also showed on the chart various options for entering the market, depending on where the price will be.
Stop loss
Under key support levels during your entry into the market.


