HBARBTC LEGHBAR/BTC is a cryptocurrency trading pair that represents the value of Hedera Hashgraph (HBAR) in Bitcoin (BTC).
In terms of technical analysis, the HBAR/BTC pair has been in a downtrend since its all-time high in September 2021. The pair has been making lower lows and lower highs, and the 50-day moving average has also been trending downwards.
The relative strength index (RSI) is currently at 30, which indicates that the pair is oversold. However, it is important to note that this does not necessarily mean that the pair will rebound immediately.
The Moving Average Convergence Divergence (MACD) histogram is also in the negative territory, indicating a bearish trend.
Overall, the technical indicators suggest that the HBAR/BTC pair is currently in a downtrend and may continue to decline in the short term. Traders should exercise caution and consider waiting for a clear trend reversal before entering a position.
HBARBTC trade ideas

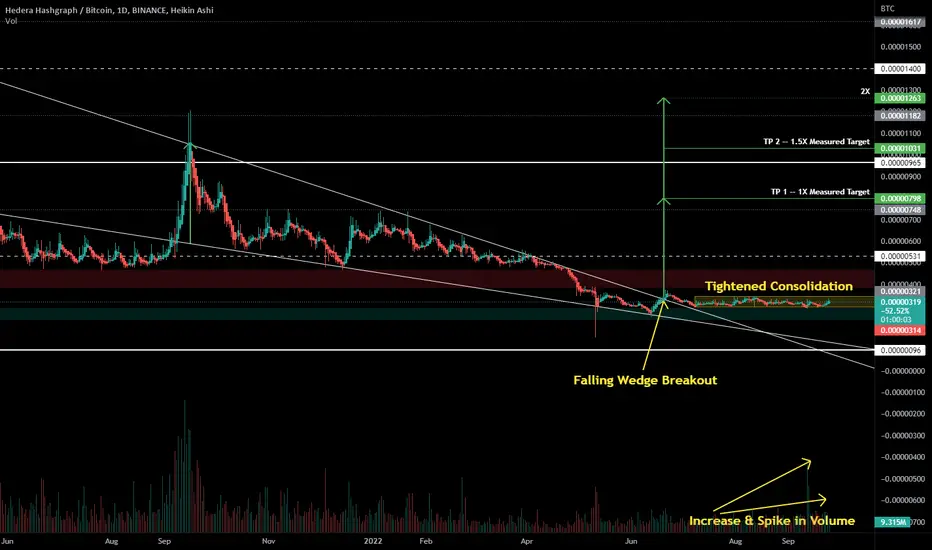
Signs of an Impending Move for Hedera vs. BitcoinAround June 19th, we broke out of a daily falling wedge (shown above), and again around end of July we broke out of a weekly falling wedge (not shown). Since then Hedera has started a pattern of consolidation within a very tight range, just above support, and below resistance. Measured wedge targets take us right at previous ATH (candle close), and a more liberal 2X target takes us above our all-time highest wick.
Each of these provide confluence that Hedera is gearing up for a move.
So, look for us to break out of the small range that we've been in for the last several weeks.
And, even if that becomes a break below the consolidation range before it breaks above, it could still act as a fulcrum for pivoting to a significant move up.
What we don't want to see is a loss of support (green box) that holds.
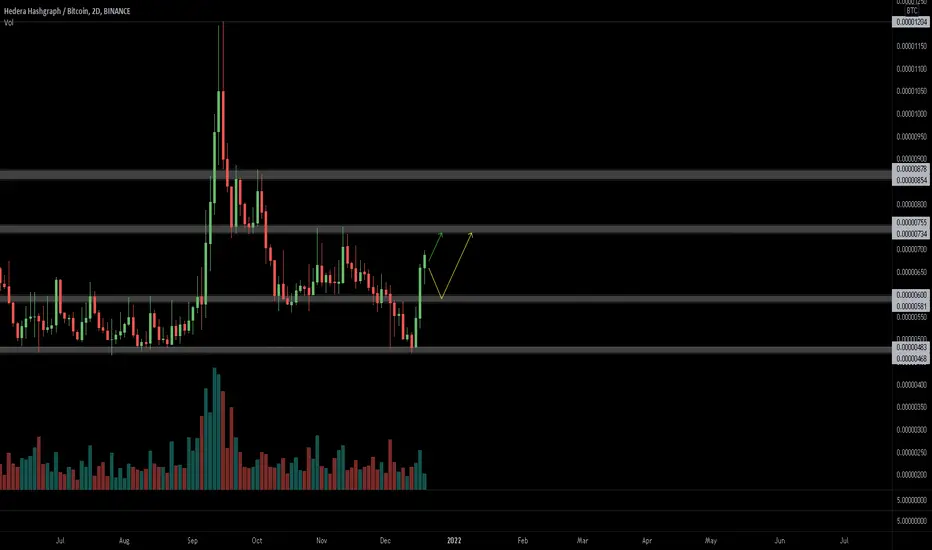
HBAR Ready to Rise for the 3rd TimeHBAR broke out of a falling wedge on its weekly chart a couple of months ago. It has since held above weekly support, and well above the wedge. If there is another dip prior to continuation, I could see it test the top of the wedge, near the bottom of support. However, if we lose support and close below the top of the wedge, this idea becomes invalidated.
Measured targets / fib levels:
-- TP 1 - 599-605 sats
-- TP 2 - 734-744 sats
Some confluence to support this idea:
-- Chart VWAP, with the full chart in view, wants average price to be near the top of the resistance area shown.
-- Zooming in to view the falling wedge moves the chart VWAP to line up with TP 1 as well (see chart snapshot below).
-- TP 1 lines up closely with our 0.618 fib (within 6 sats), where fibs are based on the previous move from trough to peak.
-- TP 2 also lines up closely with our 0.786 fib (within 10 sats)
-- RSI has bottomed out, slightly higher than our previous bottom, and it shows similar movement to the last two moves from bottom, theorizing that each in a series of 3 (assuming we've begun our 3rd move) has a consolidation period that begins closer to its initial impulse, and consolidates for a longer period each time.
-- Stoch RSI has also bottomed out and then reached top, also showing similar movement, and also theorizing that each in a series of 3 (again, assuming our 3rd move has begun) has a longer consolidation period between peak 1 and 2.
Zoomed in view of falling wedge and Chart VWAP lining up with TP 1:
Thanks for hearing my thoughts, please leave your own in the comments below. If this move does play out, I think it'll become highly likely that we see a new ATH before seeing any long-term bearish movement again. There is a linked idea for the HBAR/USD pair below under Link to Related Ideas, or here:
-dudebruh

HBAR/BTC Trading Range - [Bear Market Journey to the Green Box] Alts a very susceptible to heavy devaluation in comparison to BTC when Bitcoin is in the 'Bear Market' phase of its cycle.
Alts historically have not been a safe medium term play during this period until at least BTC has put in its cycle bottom and we are on the other side of the coming BTC halfling.
HBAR I believe will perform strong in the next bull market phase, pending strong development and delivery of project road map over the next few years.
Post is intended to track HBAR's valuation with respect to BTC over this period and into the next bull run for BTC.

HBAR - Back at Strong Support in a Right-Angled Ascending WedgeHBAR / BTC pair is revisiting the area of strong support at the bottom of its right-angled ascending wedge on its weekly chart. We arrived where we are now following a double bottom prior to the initial move up, so keep that in mind when considering targets. Long-term targets from that double-bottom are still in play, the first would be near the top of the wedge shown - but.. I'm covering both cases here bull & bear:
BULL - Hold onto support and:
1.) We should see a significant move towards the top of the wedge, and the longer we stay in the wedge, the higher that top target becomes.
2.) Break above the wedge, and our measured RAA-Wedge bull target puts us well above 1900 sats, that target is even higher now than what is presently shown on the chart because of the additional time spent within wedge, as mentioned above. Additionally, if the bullish break occurs, we enter into the realm of possibly revisiting our opening day/week highs in the mid-3500 sat range.
BEAR - Break below the wedge & lose strong support and:
1.) Our measured RAA-Wedge bear target opens up the possibility for a triple bottom, I wouldn't start considering that unless we lose the entire area of strong support however (a weekly candle close below it). It's still possible we get down into this area briefly and move back into our RAA-Wedge.
2.) Should we lose strong support and see a triple bottom, I feel like the bull case for this gets even stronger than the current one if we were to exit the top of the wedge.

HBAR/BTC looking bullishThis chart of
- HBAR/BTC ; 1 day ; heiken ashi candle sticks ; parabolic SAR ; volume
looks great. looks like we a re capitualting at a bottom here. Can see the volume increasing in the past few days also.

Simple break here for HBAR/BTCSimple break here for HBAR/BTC
Within the next two days we will be through this resistance line. It doesn't have to go far at all for the price to go 10%. And guess what, bitcoin behaving, the price will go 10% as well.

Hedera falling wedge @ resistanceI always like to keep an eye on what the BTC pairings are doing. When you get a break and rally on a BTC pair it is often very well reflected in the respective USDT pair.
Im hoping to get a 10-20% day on HBAR/USDT soon

HBAR/BTC Bull Divergence + BUY+ HBAR/USDT Double Bottom
Stop / Loss VERY TIGHT as BTC is in a downtrend. Good buy for a few hours.

Almost Time for HBARIt is very near time for HBAR to exit its Right-angled Ascending Wedge (also called: Right-angled Broadening Wedge). I'm expecting a bullish exit, though the opposite is possible. Everything points to the bull case here, we flipped resistance to support, and we've spent the last year above it, recently making higher lows. Now we have a potential inverted HS on the daily chart here, if confirmed, it would take us right to the top of our RAA wedge.
Our wedge exit target lines up with trend-based fibs, and our HSi target lines up with top of our wedge. We call that confluence.
Even the best charts can still fail, so be wary and be wary of what Bitcoin is doing, but in most circumstances with a chart like this one, we should be able to expect what it's telling us, and it's telling us that it wants to make a significant move up, and very soon.
Related ideas for the HBAR bull case are linked below, two comparisons to other similar bullish moves, and my first post about the RAA Wedge and its targets (weekly view, this is the daily view - but showing weekly trend and 2day trends for our wedge top).
Here's a candlestick view of the same chart, showing the trend-based fibs:
Here's a zoom-in on the potential HSi:
And another:

HBAR / BTC - Channel exit may indicate direction of RAAWHBAR / BTC weekly chart has formed a right-angled ascending wedge (RAAW) since double-bottoming, rising to new highs, and then creating support over its May-Aug 2020 highs.
Since peaking in Sept 2021, we've formed a corrective channel.
Exiting to the upside or downside of the channel could help indicate whether we maintain that support and see continuation of our uptrend and an eventual exit of our RAAW.
Targets for channel exits in either direction and for the RAAW are shown on the chart. Reaching TP 2 of a bullish channel exit would confirm a continuation for our RAAW.
Reaching channel bottom would confirm a bearish exit of our RAAW.
However - channel bottom lies right at the lower-end of strong support, so it's possible it could still turn up from there, but unlikely as we've held the top of that support since exiting it back in May of last year. Exiting below the channel and below strong support may lend certainty towards a bearish trend heading towards a bullish triple bottom.
The target for our RAAW lies around 1765 sats, but the mid-point for that remains a strong stopping area for me as mid 13-1400s sats are original TP 1s for the double-bottom.
Long-term targets:
- Bullish: 1440 and then 1765 sats
- Bearish: Look for a triple bottom with a stop between 92-156 sats


Hbar/btc cup and handle!hbar need to get higher than 0.888, retest it and hold it.
After this move we can expect a test of the all time high of 0.1200.
Here for you, as always, CryptoSoaP!

$HBAR, Aiming for ~750 sats from here in two potential paths$HBAR
Aiming for ~750 sats from here in two potential paths
UCTS turning bullish signals across multiple timeframes
#HBAR
HBAR underperforming BTC in long term but short-term buy signalHBAR has formed a short-term buy signals but it is underperforming against BTC in the long term.

HBAR / BTC - Successful Re-test of Weekly BreakoutBack in early -> mid September, HBAR broke out and tapped 1200 sats and then quickly corrected back to re-test it's weekly break-out trend. Bitcoin and most alts are doing the same on HTF charts, most on weekly while TOTAL crypto MC appears to be doing the same on monthly.
HBAR is among some of the first to react at this area, appearing strong and unable to reach its trend, only wicking down to this level and then a strong reaction pushing back upwards.
There was also the potential for a double top on the LTF, which brought us down to 492, but with the reaction mentioned above we failed our double top and got back above 567. At this point, if we stay above 567, we should see 720. Get and stay above 720 and our failed double top on the LTF has us heading back towards our previous ATH (prior to 1200) @ around 864 (target on the chart is 874).
If we can manage to get above 864 again and hold, we're likely to revisit our highs and potentially break above them.
Meanwhile, look out for a possible re-test of the area around 567 if we turn down momentarily. Again, if we stay above 567, HBAR should see continue moving up, above 720 a much stronger move starts becoming possible.

HBAR/BTC - 1000% gain + New Buy Signal and Double BottomThe HBAR/BTC pair has reached a double bottom + Daily Buy signal.
First of all, If you followed my analysis from the beginning of the year and you bought HBAR around 120 sats and sold it around 1200 sats you got a 10x 1000% gain.
Congrats to all of you who have followed my signals and got the balls to hold.
It is very importent to have the balls not to rebuy if the crypto pairs drop 10%. Wait until you receive a new Buy signal on the 4 hour or Daily candles. This can take weeks even months.
This all needs to be a part of your strategy. If you don't have a strategy please start one right now and improve it on the way.
Now my new analysis:
We can see a double bottom + a daily Buy signal + a 5 wave down of the Fibonacci Retracement Tool.
Wait for a clear reversal to get into this trade.
For me this reversal starts when:
- 20EMA cross up the 50SMA on the 15 minute candles. This is my first buy.
- 20EMA cross up the 50SMA on the 1 hour candles. This is my second buy.
- 4 hour and 1 day RSI is in a clear uptrend and preferably above 50 + CCI cross over above 0. This is my third buy.
My targets for the long run:
.00000645 (.236 fib)
.00000751 (.382 fib)
.00000838 (.5 fib) Here we will find some big resistance and will probably fall back to the .382 fib. Check the graph and look left.
.00000924 (.618 fib)
.00001016 (.786 fib)
.00001203 (1 fib)
.00001402 (1.272 fib)
.00001654 (1.618 fib)
I will take 30% profit when it hits the .5fib and buy it back if it comes down around the .382 fib. If it does not comes down I will not buy it back but I will have my profit.
Don't forget:
- Use a strategy, If you don't have a strategy you should start right now with following a strategy.
- Get profit or set alerts when you hit your targets.
- You can always buy it back on a retrace.
- It will not go in one straight line to the next targets.
Also keep a close eye on BTC . If BTC starts to pump it is better to move some of your profits into BTC .
Your end goal should always be to increase your BTC amount.
Cheers and have fun.
° Be Patient – Don’t panic – Trade Emotionless.
° Never lose a winning trade. You can always get back in later.

Hbar/btc looks strong! The hbar/btc pairing looks so good right now. Its holding the most important support.
If btc has stopped his bleeding we are probably ready to have some altseason gains.
Also the btc’s dominance is looking extremely bearish and ready to break the april/may ATL.
Come on hbar!!
Here for you, as always, CryptoSoaP!

Looking at HBAR's UptrendGreen line - hold with daily candle closes to maintain our uptrend (have never closed below this line since our uptrend started back in March)
Purple line - breach for a chance at having a big run
Red line - selling point, OR.. breach for a chance at a stronger uptrend

$HBAR 1. Closed below S/R
2. Reclaimed the top of the S/R and made new high
3. Higher High above the S/R
4. Retest S/R
I don't think $HBAR has much time to revisit there levels: old ATH, highest Weekly close and then maybe new ATH.

HBAR / BTC Weekly Parallels, Potential Targets, Dec Week 1 or 2Was playing around with a new idea for HBAR / BTC weekly chart here and decided to share:
HBAR has been in two different parallel channels on the weekly:
Red Parallel: started with our first move up, has weakened but still wicked to the top of the channel and hasn't yet broken below.
Purple Parallel: has held above our first move up, and has cleanly reached the top of the channel 3 times now, has yet to reach the bottom here (if it did that this week, it would be around 586 sats).
Assuming we stay at least within the purple channel, or even the red - potential targets for 3 weeks from now are drawn in white:
- Targets touching the red channel bottom, mid-point, and top are based on not dropping below the bottom of our red channel.
- Targets touching the purple channel bottom, mid-point, and top are based on not dropping below the bottom of our purple channel.
Invalidation of Idea:
Dropping and closing a weekly candle below both channels cancels this plan.
************************************************************************************************************************
Original / Related Ideas Based on a Long-term Double Bottom Pattern for HBAR are Linked Below
************************************************************************************************************************

HBAR / BTC - Double Bottom Targets ChartHere's a weekly chart showing potential targets for HBAR / BTC after having double-bottomed.
*********************************
IMPORTANT NOTES
********************************
Before we can start using this chart, we first need to get and stay above 847-864 sats (0.236 fib and previous daily ATH before it was breached).
If we don't manage to do that, a triple bottom becomes possible - so keep that in mind.
Also, note that this is an OkEX exchange chart which has a different weekly candle schedule than most exchanges, so it will look different than Binance or Bittrex, for example.
Also, the listing day ATH on Binance was 3573 sats, so if we actually revisit that area, it may go higher than what is seen on here with the high @ 3294. I'm simply using this one because it was a fresh chart with no prior drawings.
********************************
**************
TARGETS
**************
This chart shows two different potential TP 1 and 2's for our double bottom, indicated by the two different colored sets of two arrows (white - more conservative, yellow - more aggressive).
Conservative TP 1 = 1437 sats and a range around that and the 0.382 fib around 1315. A safe TP 1 might be something in between, like 1367 for example.
Conservative TP 2 = 2130 sats and a range around that and the 0.618 fib around 2070. Instead, we could also use the mid-point of TP 2 as a safer TP 2 which would be around 1786 sats
Aggresive TP 1 = 1637 sats and a range between that, our 0.5 fib of 1692, and our conservative TP 2's midpoint @ 1786. So, 1637-1786.
Aggresive TP 2 = 2438 sats, or a range between that and the 0.786 fib @ 2609.
Finally, if we can get above all of these, it's possible we re-visit or even breach our listing day high @ 3294 (3573 on most exchanges). Get above 3573, we go into a new area of price discovery.
****************************
TRADING RANGES
****************************
I like to pair our pattern targets with fibs for confluence, but also for estimating potential trading ranges.
So, we could also use the purple boxes, as well as the black areas in between them, around our targets and fib levels as potential trading ranges.

