HBAR! WHAT IS THE NEXT STEP !Hello Traders and everyone, I am Hadi Karaali, Known as SNIPERS_FX
If you like the idea, do not forget to support with a like and follow.
HBARUSDT, as we clearly see price is around a strong support zone from daily time frame
Where we will be searching for new longs right!
As we can see in the picture for the bulls to kick in from a medium-term perspective, we need a break above the upper bound which is a major swing high
However, and as we can see price broke above this minor swing high from a short-term perspective
We still need a break above the major swing high
Until that happens, we are still inside a strong support zone , and we can still dive more
For this dive to start we need a break below the lower bound as shown in the picture
Then we will be searching for new buy setups.
and as usual follow your trading plan and manage your risk.
Be patient and good luck!
HBARUSD trade ideas

HBAR - Weekly Candle body closed within the 0.618 Fib & VRVP!*Important - Once majority bashes crypto and calls it a scam and calls for lower targets (like how many did in 2018 and missed out), that is when I will be all in!
Whales/elites will not miss any opportunities into making money. They simply buy the fear, hype up the market, take profit and crash it again after taking profit. Instead of beating then, lets ride with them! ;)
Majority got Rekt last year due to listening to the "Bullish" Narratives the media and Social Media Influencers were portraying last year! Stop listening to them and start paying attention to the technicals.
Before reading, get rid of your moonboy mentality and no emotions for dips/corrections! Cannot rule bearish scenarios! Dips are for buying!!
People are so focused on the hourly/daily timeframe that they get emotional on every dip! Take a step back to the weekly/monthly timeframe and see why I'm so bullish now. Stop looking at the short-term dips/rise. Short term is irrelevant for the move that is coming!
You can't be emotional in these markets (stocks, forex, crypto, real estate, etc.). You will lose this game following the news and doing what the majority does. News creates emotions. Everything you need to know are on the charts. News is manipulated by the elites, and they take advantage of our emotions. Stop listening to the news and pay more attention to the charts. Don't follow the majority, because the majority will lose in the end! Also, don't buy the hype when everyone is buying.. instead buy the fear when everyone else is selling
Everything is on the chart! Cryptocurrencies are on the verge of exploding higher. Dips/Corrections are normal and needed in a bull market and are buying opportunities! Huge gains opportunity in the coming months! Never trade blindly. Use multiple indicators to make calculated decisions. Trade with no emotions!
Facts:
1. When RSI and Stochastic RSI are within the orange box, this has led to the best buy opportunity long term.
2. Body candle closed within the 0.618/VRVP line!! Line corresponds to the 0.618 fib and the VRVP (Highest buy/sell volume in HBAR history!)
3. Will this be a "wick" after weekly close or a candle below? If candle body breaks below the 0.618, very high chance we will head to the 0.786 fib!
4. Price is also creating a Descending Broadening Wedge!
"If you can't beat the fear, do it scared!"
"Be fearful when others are greedy, and greedy when others are fearful!" - Warren Buffet.
"Markets are a device for transferring money from the impatient to the patient. - Warren Buffet
"Show me the charts, and I'll tell you the news." - Bernard Baruch
"The secret to investing/trading is figuring out how rich you want to be and how poor you're willing to become."
"If you want to live like the 5% of the population who are hugely successful, then don't act like the 95%!"

HBAR Pattern ComparisonComparing the pattern prior to the previous run-up vs. where we are now, this is the 3-day chart we're viewing. I've copied and stretched it out in order to re-size our old pattern vs. today's pattern.
HBAR likes to repeat similar patterns, let's see if it happens once again.
Related ideas linked below under Links to Related Ideas.


#HBAR/USDTTrade setup: Trading in a Sideways Channel ($0.06-$0.08), with $0.06 support having recently received big buying volumes interest. (set a price alert).
Pattern: Price is trading in a Sideways Channel , which is a neutral pattern (indication of market indecision). Trend Traders ought to wait for a breakout in either direction, although typically it breaks in the direction of the existing trend. Swing Traders can trade the range – Buy near Support and Sell near Resistance.
Trend: Downtrend across all time horizons (Short- Medium- and Long-Term).
Momentum is Mixed as MACD Line is below MACD Signal Line (Bearish) but RSI ~ 50 (Neutral).
OBV (On Balance Volume): is declining, indicating that volume on Up days is lower than volume on Down days. Hence, demand (buyers) is below supply (sellers).
Support and Resistance: Nearest Support Zone is $0.060. The nearest Resistance Zone is $0.080, then $0.100.

Expanded Flat Correction Soon or Longer Accum Phase FirstThere have been two bull runs so far for HBAR, each forming higher levels of support above its previous lows. It appears to be consolidating above the area of the first run; similar to how it consolidated above its original lows before the 2nd run. Trend-based fib extension also has the chart consolidating above the 1.618 fib of what could be an expanded flat correction, which I've posted about previously (linked below under related ideas).
This chart shows two theories about that:
1.) a bull run soon from a typical expanded flat correction - everything appears lined up for that, and it has broken its 3-day downtrend, but is still missing the volume spike needed for that run
2.) without that volume spike soon, there may be a 3rd and longer accumulation phase that drags out to some date prior to the 2024 btc halving
Note that the last two runs also had long and longer accum phases as well. Either is possible, and there still hasn't been a strong test of support since initially getting here, which could also be a possible trigger for the spike that is needed.

HBAR Nearing Completion of Expanded Flat CorrectionThis is the weekly chart. A while back I published an idea that HBAR could be completing and expanded flat correction. This is an update on that, using the weekly chart - which makes things more clear. Here's why:
1.) Trend-based fib - has us ending correction right at the 1.618 fib, which is exactly what should be expected in an expanded flat
2.) EW wave count appears valid here
3.) Weekly support - we've so far held weekly support (lose this and this idea may be invalidated, however)
4.) 192-day Gann Cycles (for major pivots) - HBAR is 6 weeks away from starting its next 192-day Gann Cycle, which has so far worked quite well in its history for detecting major pivots (up or down)
5.) Falling wedge pattern on weekly - weekly chart shows a falling wedge pattern, where we've broken out of it and are currently re-testing near the top of the trend (and weekly support)
Falling wedge zoom-in, weekly line chart:
Again, we need to hold the weekly support area and remain above the falling wedge for this to stay valid. But, if this does turn out to be an expanded flat, we should start seeing some rather bullish movement in the coming weeks/months, which could even lead to a new ATH.
Also - be sure to keep an eye on Bitcoin Dominance when considering the alt market. It is nearing a major decision which will likely determine how alts behave, and that is likely to happen any day now. See related ideas below.

Why Hedera Hashgraph is among our Top AssetsHedera Hashgraph (HBAR)
What is it: a public cnetwork for creating decentralized applications (dApps). HBAR leveraged distributed ledger technology known as a hashgraph
Compred to other networks, HBAR is very fast
1. BTC= 5 transactions per second (TPS)
2. Eth= 15 TPS
3. HBAR= 10,000 TPS
Benefits:
1. No mining required; environmentally friendly
2. $0.0001 transaction fee vs Etherium's insane gas fees
3. Implements a DLT with the same security and anonymity as blockchain based ledgers
4. High processing capacities.
5. Governance includes 39 powerhouse entities that include Google, LGUS and Boeing.
6. HBAR has a circulating supply of 22.9B and a max supply of 50B. All 50B tokens had been mintd before mainnet launch in 2018
Remember: life often disrespects charts so trade with caution
------
Market order position upon the confluence of valid entry rules on the 4H or 1H chart.
-=ENTRY RULES=-
Trading philosophy: Don’t short at the lowest of the bearish momentum nor do we long at the peak of a bullish impulse. The safest entries are at the end of a retrace on the 38.2%, 50%, 61.8% or 78.6% fibonacci back in the direction of the master trend.
Note: I use Daily/4H or 4h/1H market structures with wave analysis to prep for potential entries. The RSI , MACD and EMA indictors are confirmation for entries at the 4H or 1H timeframe
For ORDER BLOCK trades
When price reaches a bearish or bullish orderblock, ascertain the price reversal by means of
1. Dojis
2. Morning/evening stars
3. Several wicks.
4. Engulfing candles or three white soldiers in the opposite direction
5. Marbouzou in the opposite direction.
6. Break of trendline or fast EMAs
For SHORT:
4H chart should confirm that the bullish retrace had turned bearish in the direction of master trend. The MACD should have dropped below zero signifying a bearish environment. Price would have dropped below the 10 and 20 EMA . For good measure, check that the 4h and D1 RSI is below the 50 signal line
For LONG:
4H chart should confirm that the bearish retrace had turned bullish in the direction of the master trend. The MACD should have gone above zero signifying a bullish environment. Price had gone above the 10 and 20 EMA . For good measure, check that the 4h and D1 RSI is above the 50 signal line
Divergences:
The 4H, 8H and 12H chart can reveal hidden divergences on the RSI , MACD , Money Flow Index, CMFI, On Balance Volume and Stochastics. When one or more divergences manifest- be ready. Trend reversal is coming. My best practice is to wait for at least an RSI divergence on the 4H, then drop to M15 to see price shifting with a 50EMA aligned with the 4H divergence.
About me
I am not a financial advisor nor a signal provider. These are the opinions of a 20-year private trader in the legal profession as well as a businessman diversified in the tech and hospitality industries. My favored tools of the trade include wave analysis, price action on the 4H to Weekly timeframes and institutional order flow ( COT data).
In partnership with capital markets research group Plazo Sullivan Roche Capital of Mahe, Seychelles
HBAR Long Idea2020 Resistance has now become support, we like this area for a long as a non leveraged trade with an SL RISK of 4 to 5%.

HBar under $0.18 is a bargainHBar is likely to move up to test higher price levels soon, we have a high likelihood of testing the 0.236 during during indicated zones.

Hedera HBAR updateIF HBAR makes contact with the 0.236 fib retracement zone at $0.18 during 2022 we could see price for HBAR soar above $0.30 by mid 2023

HBAR Muhhey traders
check the chart and lvls
is this even possible ?
i guess it is
give the market some time

HBARNot financial advice. The essence of investing & trading is the intelligent and patient preying on the greed, fear, impatience, addiction and ignorance of the majority. It's definitionally Darwinian.

HBAR - Best buy opportunity of a lifetime is near!Whales/elites will not miss any opportunities into making money. They simply buy the fear, hype up the market, take profit and crash it again after taking profit. Instead of beating then, lets ride with them! ;)
Majority got Rekt last year due to listening to the "Bullish" Narratives the media and Social Media Influencers were portraying last year! Stop listening to them and start paying attention to the technicals.
Before reading, get rid of your moonboy mentality and no emotions for dips/corrections! Cannot rule bearish scenarios! Dips are for buying!!
People are so focused on the hourly/daily timeframe that they get emotional on every dip! Take a step back to the weekly/monthly timeframe and see why I'm so bullish now. Stop looking at the short-term dips/rise. Short term is irrelevant for the move that is coming!
You can't be emotional in these markets (stocks, forex, crypto, real estate, etc.). You will lose this game following the news and doing what the majority does. News creates emotions. Everything you need to know are on the charts. News is manipulated by the elites, and they take advantage of our emotions. Stop listening to the news and pay more attention to the charts. Don't follow the majority, because the majority will lose in the end! Also, don't buy the hype when everyone is buying.. instead buy the fear when everyone else is selling
Everything is on the chart! Cryptocurrencies are on the verge of exploding higher. Dips/Corrections are normal and needed in a bull market and are buying opportunities! Huge gains opportunity in the coming months! Never trade blindly. Use multiple indicators to make calculated decisions. Trade with no emotions!
Facts:
The Best Opportunity is when the RSI and Stochastic RSI are in between the Orange Box and the Fear and Greed index is at "Extreme Fear"!
"If you can't beat the fear, do it scared!"
"Be fearful when others are greedy, and greedy when others are fearful!" - Warren Buffet.
"Markets are a device for transferring money from the impatient to the patient. - Warren Buffet
"Show me the charts, and I'll tell you the news." - Bernard Baruch
"The secret to investing/trading is figuring out how rich you want to be and how poor you're willing to become."
"If you want to live like the 5% of the population who are hugely successful, then don't act like the 95%!"

$Hbar - Hedera - Technical AnalysisBasic TA that can be applied to any charted asset. Untapped Monthly/Weekly/Daily levels, Value Areas H/L/POC
Video cut short, might try for a follow up video once TA is complete :)

HBAR - Top Is In AugustThe TOP will likely be in August.
For now, the levels I've identified as possible reversals are 0.089 and 0.109.
Good luck

HBARUSD 2023 The Maths lines up for HBAR. Fundamentally the project is great IMO. Ready for the next big HYPE cycle.
NFA

h-bar could give nice returns Except a pump anywhere between 10 to 30 percent atleast
take profits in steps
Peace out


Potential BreakoutHBAR is inside a channel and besides the hidden bearish divergence looks like it could breakout. I don't see any edge to go long here, but I will be keeping an eye on Hedera because the weekly chart looks great here.

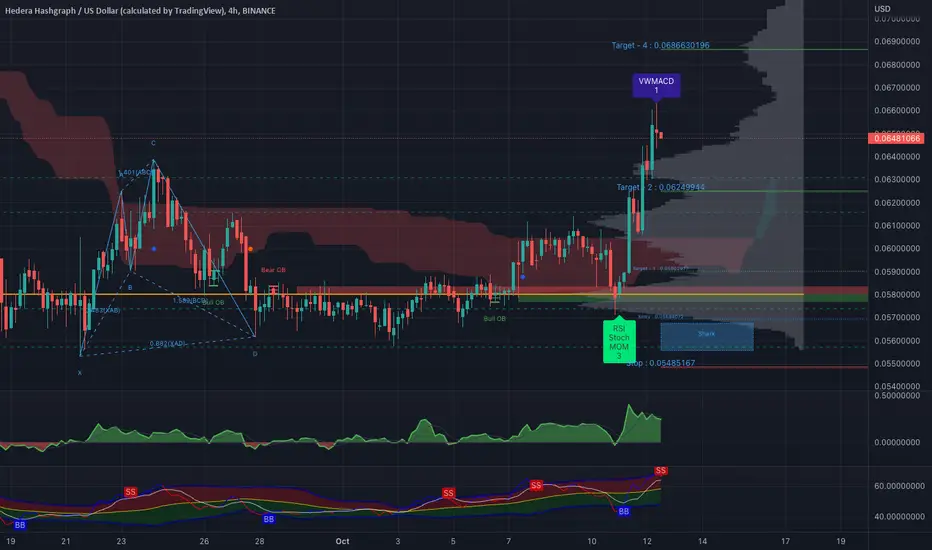
HBAR - Longterm View!Hello Kucoin S Family / Fellow Traders. This is Richard, as known as theSignalyst.
WEEKLY: Left Chart
HBAR is approaching a strong support and demand zone so we will be looking for buy setups on lower timeframes.
H4: Right Chart
HBAR formed a valid double bottom. For the bulls to take over, we need a break above the necklinemarked in gray.
Trigger => Waiting for a momentum candle close above the last high in gray to buy.
Meanwhile, until the buy is activated, HBAR can still trade lower inside the blue demand zone .
Always follow your trading plan regarding entry, risk management, and trade management.
Good luck!
All Strategies Are Good; If Managed Properly!
~Rich

HBAR - Long term bullish! Things to watch for!Whales/elites will not miss any opportunities into making money. They simply buy the fear, hype up the market, take profit and crash it again after taking profit. Instead of beating then, lets ride with them! ;)
Before reading, get rid of your moonboy mentality and no emotions for dips/corrections! Cannot rule bearish scenarios! Dips are for buying!!
People are so focused on the hourly/daily timeframe that they get emotional on every dip! Take a step back to the weekly/monthly timeframe and see why I'm so bullish now. Stop looking at the short-term dips/rise. Short term is irrelevant for the move that is coming!
You can't be emotional in these markets (stocks, forex, crypto, real estate, etc.). You will lose this game following the news and doing what the majority does. News creates emotions. Everything you need to know are on the charts. News is manipulated by the elites, and they take advantage of our emotions. Stop listening to the news and pay more attention to the charts. Don't follow the majority, because the majority will lose in the end! Also, don't buy the hype when everyone is buying.. instead buy the fear when everyone else is selling
Everything is on the chart! Cryptocurrencies are on the verge of exploding higher. Dips/Corrections are normal and needed in a bull market and are buying opportunities! Huge gains opportunity in the coming months! Never trade blindly. Use multiple indicators to make calculated decisions. Trade with no emotions!
Facts:
Whenever HBAR are in between orange boxes within the RSI and Stochastic RSI, it marks a huge buy opportunity long term! Note that we also consolidated for 98 days in the past before skyrocketing to all time high! Patience is key!
"If you can't beat the fear, do it scared!"
"Be fearful when others are greedy, and greedy when others are fearful!" - Warren Buffet.
"Markets are a device for transferring money from the impatient to the patient. - Warren Buffet
"Show me the charts, and I'll tell you the news." - Bernard Baruch
"The secret to investing/trading is figuring out how rich you want to be and how poor you're willing to become."
"If you want to live like the 5% of the population who are hugely successful, then don't act like the 95%!"

