HEDERA - DCA ideas at these LEVELSHEDERA - DCA ideas at these LEVELS 💡HEDERA is dropping to a previous low. I plan on Dollar Cost Averaging up to .40
HBARUSD trade ideas

HEDERA’S Q4 2024—$HBAR SURGES ON CHAIN GROWTH & ETF RUMORSHEDERA’S Q4 2024— CRYPTOCAP:HBAR SURGES ON CHAIN GROWTH & ETF RUMORS
(1/9)
Good morning, Tradingview! Hedera’s Q4 2024 is blazing—chain GDP hit $840M, up 213% QoQ 📈🔥. Meme coins and dApps drove the surge, with CRYPTOCAP:HBAR up 30% overnight. Let’s unpack this blockchain beast! 🚀
(2/9) – NETWORK PERFORMANCE
• Q4 Chain GDP: $840M, +213% QoQ 💥
• TVL: $8.6B, DEX Volume: $3.3B/day (+150%)
• Stablecoin Volume: $5.1B/day (+36%)
• Jan ‘25: $517M app revenue, $552M econ value
Hedera’s humming—10k TPS at $0.0001 fees!
(3/9) – BIG MOVES
• Q3 Asset Tokenization Studio: Enterprise appeal soars 🏦
• Feb 9 X Buzz: HBAR ETF rumors, NVIDIA/Intel AI chip embeds 🌍
• Coinbase HBAR Futures: Drops today, Feb 18! 🚗
Speculation and scale are lighting up $HBAR!
(4/9) – SECTOR CHECK
• Market Cap: $11.61B (Jan ‘25), Now $0.39-$0.40 🌟
• Vs. L1s: ETH ($400B), SOL ($88.6B), ADA ( FWB:20B )
• Outpaces in speed/cost, 53% of global L1 fees Dec ‘24
Undervalued sleeper vs. giants? X thinks so!
(5/9) – RISKS TO FLAG
• Volatility: Feb 8 drop hints manipulation 📉
• Regs: ETF hype could flop if SEC stalls ⚠️
• Competition: SOL’s Firedancer, ETH scaling loom 🏛️
• Meme Coin Fade: Speculative juice may dry up
(6/9) – SWOT: STRENGTHS
• Speed: 10k TPS, $0.0001 fees slay 🌟
• Q4 Stats: $840M GDP, $8.6B TVL 🔍
• Enterprise Edge: Nairobi Stock Exchange, SpaceX 🚦
Hedera’s a lean, mean blockchain machine!
(7/9) – SWOT: WEAKNESSES & OPPORTUNITIES
• Weaknesses: Meme coin reliance, smaller dApp pool 💸
• Opportunities: ETF approval, NVIDIA/Intel deals, DeFi push 🌍
Can CRYPTOCAP:HBAR turn hype into lasting heat?
(8/9) – CRYPTOCAP:HBAR ’s Q4 fire—where’s it headed?
1️⃣ Bullish—ETF & tech blast it up.
2️⃣ Neutral—Growth holds, risks bite.
3️⃣ Bearish—Speculation fizzles out.
Vote below! 🗳️👇
(9/9) – FINAL TAKEAWAY
Hedera’s Q4 shines—$840M GDP, ETF buzz, and tech leaps fuel CRYPTOCAP:HBAR ’s charge 🌍. Cheap vs. L1s, but volatility lurks. Gem or trap?

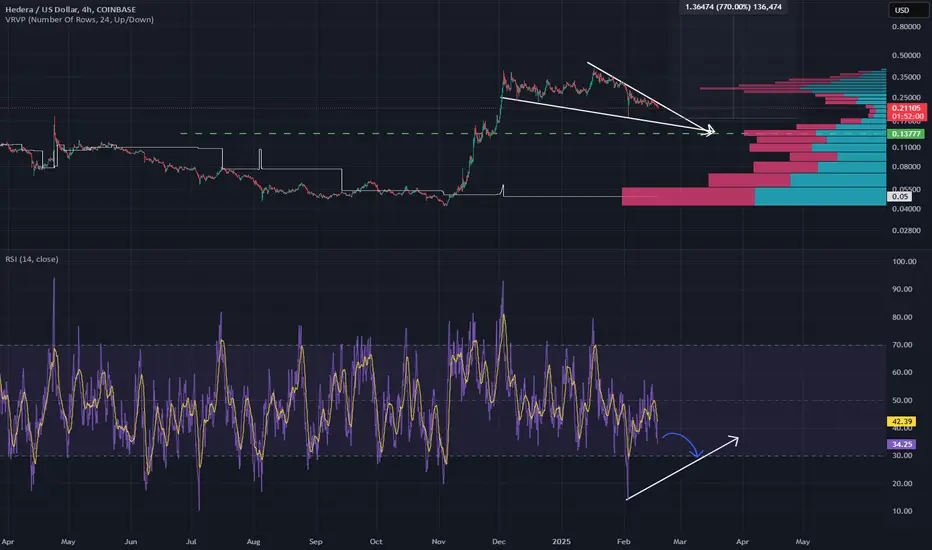
Is HBAR wedging down into support and a potential convergence?Seems to me that the HBAR correction we're watching is forming a falling wedge down into what the volume profile shows as a very significant volume spike.
Notice as well, the wedge pattern is forming off a very significant dip (2nd biggest in approx 12 months) and this very low RSI reading is unlikely to be broken.
If HBAR breaks the 18 cents mark but puts in a higher RSI, as long as it respects the support vector of the wedge (and, more broadly, the lateral support vector of that big volume influx), then we should end up with a very bullish outline that shows a big falling wedge along a big RSI convergence pattern that forms atop a significant support vector comprised of the big volume influx.
A very bullish outline overall.
My view here is that you should DCA into the 18 cents mark and put your stop somewhere below it in case the market cucks us all.
Good luck and happy trading!
HBAR (Hedera Hashgraph) - Favorite Token, w/in the Crypto Spaceas of today, Sunday 16 February'25, here are some anecdotes/narratives pertaining to where I think we are with the Hedera Hashgraph Token (TICKER:HBAR). Please examine my Comments, laid-out on the Chart.

the inside is the outside. the past is the future.for those that love hbar... i also love it. hashgraphs are a big step up


Hedera Hashgraph: Target Zone AwaitsFollowing the recent sharp sell-off and the immediate rebound, Hedera Hashgraph’s HBAR has stabilized just above $0.20. Currently, the coin is attempting a small breakout to the upside. If HBAR manages to surpass the $0.39 resistance at this stage, the next impulsive move of the green wave alt. will begin earlier than primarily expected (33% likely). In our primary scenario, however, the price should still drop into our beige long-entry Target Zone between $0.17 and $0.08. There, the low of the green correction wave should be settled before wave can advance beyond $0.39.

Trading Signal : HEDERA ($HBAR) - 1D - APPROACHING SUPPORTTechnical Analysis:
The price broke out of a Bullish Pennant but faced rejection at $0.39 resistance, where it has been rejected twice before. The recent pullback to $0.23 support presents a potential swing trade entry opportunity within the ongoing uptrend, with +30% upside potential to $0.30 (TP1) and $0.39 (TP2).
Momentum is bearish but improving, as MACD Histogram bars are rising, suggesting that momentum may be nearing an upswing. Price is currently neutral based on RSI-14 (neither overbought nor oversold).
Entry Zone:
Enter near $0.23 support as a swing trade in an uptrend.
Targets (Take Profit):
TP1: $0.30 (+30%).
TP2: $0.39 (if bullish momentum sustains).
Stop Loss:
Below $0.21 to limit downside risk.
This notification constitutes a marketing communication. The information provided does not constitute a recommendation, offer, or solicitation to buy or sell any crypto-asset. It is not intended as investment advice, and no consideration has been given to the specific investment objectives, financial situation, or individual needs of any recipient. Any decision to act on the information provided is made at the sole discretion of the recipient. SwissBorg disclaims any liability for losses arising from the use of this material. Recipients should consult their own professional advisors before making investment decisions.

HBAR Seeking Golden Ratio After False Break of Consolidation?There's some big tells in what COINBASE:HBARUSD could potentially be getting ready to do so lets break it down on the Daily Chart!
Since the High on Dec. 3rd @ .392, Price has steadily been forming what looks to be a Descending Triangle while finding Support in the ( .25 - .23 ) cent range. Bearish volume building and RSI going from Overbought to currently going Below 50 suggests further Bearish Price Action could occur!
After the Positive USD Economic News Results for ISM Services and JOLTS Jobs Openings coming in well above Forecast, this seen the Dollar gain strength and other markets like Stocks and Crypto take a dive, in COINBASE:HBARUSD instance, it generated a False Break of the Descending Triangle to now where we see Price plummeting down to test the Support of this Consolidation Pattern.
If Support breaks, we could see Price make a Retracement to the April 2024 Highs @ ( .18 - .15 )
This area looks especially favorable because:
-From the Low before the Rally @ .04172 to the High of the Rally @ .392, lands the Fibonacci Golden Ratio levels priced @ ( .19619 - .17553 ) with the April 2024 High @ .1842 right in the Middle of this Zone!
-The 200 EMA is curving up into the suspected Support of the April 2024 Highs if Price were to fall, it would test this as well!
*If Price continues to fill the Pattern more, keep an eye out for more False Breaks, this will be evident with Price breaking either Area of Value ( Falling Resistance or Support Zone) followed with minimal Volume.

HBARUSD Few consolidation days, then $0.65Hedera (HBARUSD) breached through its 1D MA100 (green trend-line) yesterday but recovered immediately as the 1D RSI almost turned oversold (<30.00). We expect a few more days of consolidation and buy accumulation, similar to the April 13 2024 consolidation on the 1D MA200 (orange trend-line), before the next Bullish Leg.
On the April fractal, the price rebounded to the 1.236 Fibonacci extension to make a peak on the Higher Highs trend-line. With the two fractals having also similar 1D RSI patterns, similar rebound would place our Target at 0.6500.
-------------------------------------------------------------------------------
** Please LIKE 👍, FOLLOW ✅, SHARE 🙌 and COMMENT ✍ if you enjoy this idea! Also share your ideas and charts in the comments section below! This is best way to keep it relevant, support us, keep the content here free and allow the idea to reach as many people as possible. **
-------------------------------------------------------------------------------
💸💸💸💸💸💸
👇 👇 👇 👇 👇 👇

Noon Update, 02Feb2025 - HBAR Hedera Hashgraph...of course..., almost immediately following publication of my latest Chart for the HBAR Token, my Buy Limit Order set to purchase 1,000 Tokens at USDC 0.271, decided to Execute!
So, I've updated the relevant parts of the Chart, as well as, set a new Buy Limit Order.
Please enjoy.

Hedera Daily: Beware of the Bearish Dragon Pattern
In my previous article, I focused on Elliott Wave counts for HBAR.
()
This time, I’ll approach the analysis from a different perspective:
1. **Dragon Pattern**
2. **Weekly Candlesticks**
3. **Parallel Channel**
4. **Oscillator**
5. **Fundamentals**
6. **Key Levels**
7. **Short-term Forecast and My Position**
---
### 1. Dragon Pattern
The Hedera daily chart suggests a bearish “Dragon Pattern” forming. For a reference on a previous Dragon Pattern in Bitcoin, see:
()
---
### 2. Weekly Candlesticks and the Dow Theory on the daily
Overlaying the weekly candlesticks schematically also indicates a clear bearish bias. Unless the weekly candle closes bullish—or at least recovers to 31 cents—the continuation of the downtrend looks very likely. The daily lower-low in the Dow Theory we already have might emphasize the bearish sentiment more.
---
### 3. Parallel Channel
The price has dropped below the yellow line on the diagonal parallel channel. The following likely targets appear to be the light blue or gray lines. Considering this, it seems natural to expect a move toward the green box, although the path may involve some fluctuations.
---
### 4. Oscillator
At the same time, the oscillator values remain at their respective low levels, suggesting a scenario where any downward move might be more gradual than abrupt. However, such a steep decline itself isn't excluded at the extreme of oscillator values.
---
### 5. Fundamentals
From a fundamental standpoint, overall market sentiment is pessimistic, influenced by the DeepSeek shock and U.S. tariff concerns, making a short-term return to optimism seem unlikely. However, from a TA perspective, this aligns with the scenario many have been anticipating. If a decline materializes now, it may reflect the market providing its catalyst.
---
### 6. Key Levels
On the downside, the area near the 23-cent low is almost particular to command attention. I watch around 17.5 cents (the top of the green box). If the price does reach this level, panic selling could spark wicks down into the 15-cent region. Although the bottom of the box is around 12.6 cents—and the likelihood of dropping that far seems slim—long-term HBAR holders like myself would welcome the opportunity.
---
### 7. Short-term Forecast and My Position
As I posted on X (formerly Twitter), I’m currently short 34.5 cents and plan to take profits around 17.9 cents. Since a minor bounce could happen first, I don’t intend to add to my short position at this level. My spot buy orders are scattered from around 24 to 15 cents, illustrating my long-term bullish stance on Hedera.
For a bullish take, feel free to check out my earlier analysis (admittedly a bit optimistic, but I’m confident in the overall movement):
()

my thoughts, as they pertain to HBAR Hedera Hashgraph --On the Chart, I've placed Notes and/or Emoticons at various points, which explain/summarize my thoughts/emotions beginning with the Presidential Election through 'Right Now.'
My hope is that TradingView Users find this interesting and it provides some solidity to your own convictions. You'll also note two (2) price-points where I've set Limit Orders to purchase more HBAR Tokens -- because, I'm quite Bullish.

Hbar market indecision if we lost 0.29 i see Hbar at .26
if we break 0.328 we will try again the 0.35 resistance

HBAR Headed For A DropBased on what I am seeing, HBAR, at some point, will be dropping to the .20cents range. Do not panic and sell. Hold and buy more. HBAR will go back to the 30 cent zone after. Fear not!

HBAR DOUBLE BOTTOM W REVERSAL ON 45 MIN CHARTThe 45-minute chart for HBAR reveals a potent double bottom reversal pattern, hinting at a potential trend reversal. A decisive break above the resistance level of 0.3230 could trigger a significant run-up to 0.34.
Key levels to monitor:
Resistance: 0.3230
Target: 0.34
A successful breakout above 0.3230 may lead to a retest or pullback before HBAR embarks on a new leg upward, offering a potential buying opportunity. Traders should closely watch the 0.3230 level for a confirmation of the reversal pattern

Are we sending HBAR higher or in Buy The Dip mode?While liquidity is drained from many altcoins and prices stagnate, HBAR is showing an impressive performance.
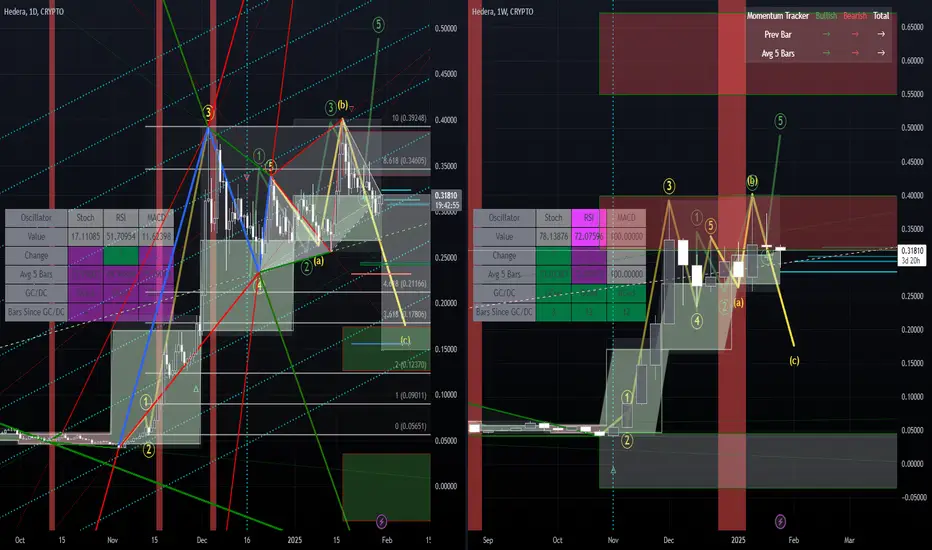
Will HBAR continue on to challenge its 2021 high and achieve a new ATH (All-Time High)? As a self-proclaimed Elliottician, there's one point that concerns me. This correction since December 3rd has been too prolonged—it's difficult to interpret it as a single wave cluster.
In one possibility, we might have already entered a new progressive wave (the circled green 1-2-3-4-5). However, it takes on the somewhat exceptional form of a leading expanding diagonal in that case.
If the bullish scenario takes an exceptional shape, let's also consider exceptions for the bearish (correction) scenario. In this case, isn't truncation a possibility? In other words, the high on Christmas might have been the end of the upward wave following a correction that could be WXYXZ as an impulsive wave 4. There are multiple possible ways of counting, but in this case, it's possible to count the high on January 17th as the B of an expanded flat—that is, the B as an irregular top.
Turning our eyes to the weekly chart, the red box clearly functions as a resistance zone, and it appears to have formed a double top. If candlesticks are pushed out from this resistance zone, it would be natural to anticipate movement in a downward direction.
Nevertheless, HBAR holders, including me, will simply accumulate more if the price drops, won't they? Will that opportunity present itself?
HBAR to $1.00HBAR is currently in a bullish channel/bullish triangle pattern. Looking for a push to the 141.00 fib level for the first target.

HBAR is currently trading at equilibrium.Using my "grafting" trading technique, HBAR is currently trading exactly at the point of equilibrium. This could be either bullish or bearish, depending on the pattern, but it appears that HBAR could potentially drop down to #4 on the wave count, sweeping the lows before making a significant move to the upside.
Nothing in trading is guaranteed, but this pattern plays out in the same fashion frequently.
Good luck, and always use a stop loss!

HBARUSD - Weekly forecast, Technical Analysis & Trading IdeasMidterm forecast:
While the price is below the resistance 0.40089, beginning of downtrend is expected.
We make sure when the support at 0.22979 breaks.
If the resistance at 0.40089 is broken, the short-term forecast -beginning of downtrend- will be invalid.
Technical analysis:
A peak is formed in daily chart at 0.40140 on 01/17/2025, so more losses to support(s) 0.29204, 0.26950, 0.24919 and minimum to Major Support (0.22979) is expected.
Take Profits:
0.29204
0.34000
0.37397
0.47800
0.57563
__________________________________________
❤️ If you find this helpful and want more FREE forecasts in TradingView,
. . . . . Please show your support back,
. . . . . . . . Hit the 👍 BOOST button,
. . . . . . . . . . . Drop some feedback below in the comment!
🙏 Your Support is appreciated!
Let us know how you see this opportunity and forecast.
Have a successful week,
ForecastCity Support Team
0.57563

HBAR 1-hour .. Long in progressI like trading with HBAR.
It still has good volatility.
Placed an order before I went out on the town last night. Now I am in the trade.
Considering to do a scalp trade(s).
It's a tiny 521 dollar order.
Since my volume this month is higher my fees total (for entering and exiting) are "under 1%" .. I will start scalping with this in mind.
COT = 1% now (cost of trade)

HBAR another opportunity to entryAll confirmations and pullback triggered with the following criteria..
- Touched Support channel
- Resistance turned into support
- Strong Fibo pullback level
- FVG level

Went Long on HBAR and made 68% Using proprietary chart overlays to do the math and predicting for me. So far it's working well. I buy on the green and sell on the red. Cheers to simple trades for more profits. Swing trading one coin at a time.
