HBAR consolidated into bullish triangle. Uptrend to start soonI believe the uptrend for hbar will begin soon again with significant gains. Were looking for at least $0.45.
The pressure is mounting and it should lift off soon. End target for me is a $60b marketcap at around $1.50
HBARUSD trade ideas


HBARUSD This rally isn't over yet.Hedera (HBARUSD) is having a far from impressive rally, as it is rising for 5 weeks non-stop, having so far completed a +820% price increase from the U.S. elections and the November 04 1W candle.
This incredible 5-week green candle streak is technically far from over, as HBAR appears to be repeating the Parabolic Rally of its previous Cycle from January 04 2021 to March 15 2021. This is the closest sequence to today's rally and still the current one is more aggressive!
If HBAR completes that fractal (+1520% rise), then we should see at least $0.6500 before any correction back to the 1W MA50 (blue trend-line).
-------------------------------------------------------------------------------
** Please LIKE 👍, FOLLOW ✅, SHARE 🙌 and COMMENT ✍ if you enjoy this idea! Also share your ideas and charts in the comments section below! This is best way to keep it relevant, support us, keep the content here free and allow the idea to reach as many people as possible. **
-------------------------------------------------------------------------------
💸💸💸💸💸💸
👇 👇 👇 👇 👇 👇

Hbarusdt lol unreal pumps Mf is olmost at 100 on the weekly it’s crazy . Money will rotate to other alts , Hbar and xrp are done for a while . I think Hbar retraces here they like doing 30% pullbacks I notice so not recommending short because it’s a dangerous game I will because I don’t care .

HBAR responding bullishly to its goldencross just like Algorand We can see here how Hbar is immediately responding to its golden cross and finally breaking above the inverse head and shoulder pattern it’s been consolidating in right at the moment of the golden cross. Here is the algorand goldencross for comparison:
Countless other charts have had this same reaction since the parabolic phase of the bull run and I wouldn’t be surprised if it continues. *not financial advice*

Plenty of upside left in HBARUSD even after massive 55% pump HBAR had a huge breakout today and shot way past the breakout target of the previous patter it had ust broken upward from. In doing so Price action is getting very close to completing the right shoulder of a much bigger inverse head and shoulders patter here. Should it trigger the breakout of this attern we ca see that the measured move target for it would be over 120% gains from where price currently is if it were to reach the full target. It may take it a second consolidating just below , or back &forth a little above and below the neckline of this pattern before it triggers the breakout since it just had such a massive pump, however it could just maintain the current momentum and plow right through that neckline without stopping for much of a rest. The most import support to watch for at the moment is the weekly 200ma(in blue) as long as it can flip that 200ma to solidified support then odds are good it will confirm the breakout from this invh&s pattern to too many candles after that. Also considering the total2 chart looks like it will confirm the long awaited breakout from its cup and handle patter soon, that increases the probability that this new bigger invh&s on HBAR wll be confirming its breakout too sooner rather than later. *not financial advice*

Has HBAR broken out vs Bitcoin?HBAR looks ready for a major push higher after breaking through major resistance on the weekly, monthly, quarterly and yearly.
If it can maintain this strength for the rest of this month, 2025 COULD be a big year!
In the near-term, there should be a pullback as HBAR is pretty stretched on the RSI.

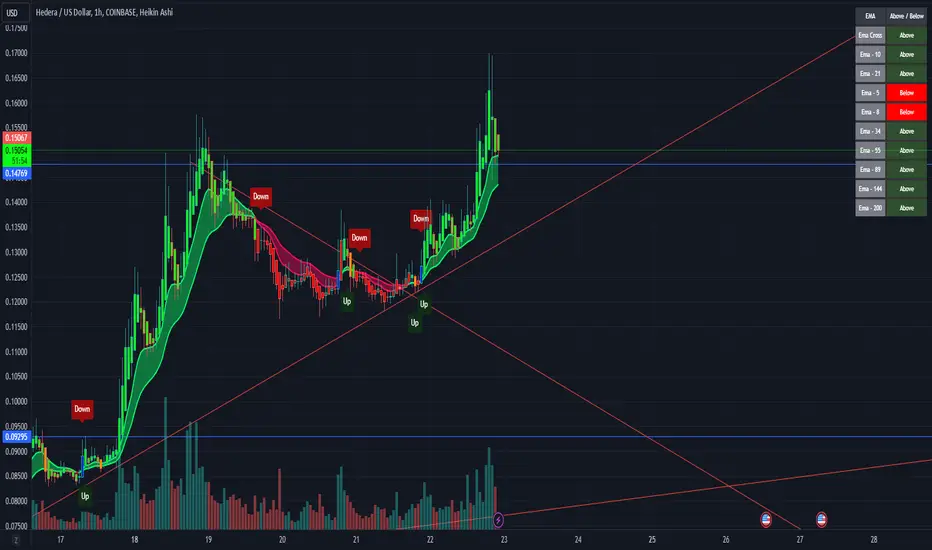
Breaching upwards in a 1HR Candle-breakout is HBARUS
This Crypto is looking good lately and as traders turn to lesser known Crypto's that may have a better risk to reward ratio, I am talking about ones like Hedera Hashgraph that only recently got it daily 200ema to be just near price and preferably directly underneath price on a Daily chart.
Then price snaps upwards with ease because all of the EMA's are stacked correctly with 8ema at the top just below price, then directly underneath the 8 is the 13ema, directly under the 13 is the 21ema etc.
Let's look again at the breakout occurring right now on price.
Here is an historical look at price for HBARUS :

Symmetrical triangleLooks like a symmetrical triangle is forming, I would expect a uptrend in the near future.

Invh&s pattern on the 3hr hbarusd chartThs was such a nice picture perfect little inverse head and shoulders that I felt like posting it. Heading to its target should help us flip the resistance of this rumple horizontal trendline to solid support as well. *not financial advice*

Short-term falling wedge on HBAR/USDShort-term falling wedge on HBAR USD.
There is a more obvious bullish convergence pattern on smaller timeframes but trading view is rubbish and won't let me publish short-term charts to demonstrate this.
However, if that finer-res convergence pattern persists, I expect it to migrate onto bigger timeframes soon.
I'd look for a serious break of the trendlines to invalidate this.
This should resolve within a few hours.

HBAR Macro Bullish, Yet Be Wary of Potential LTF Retracement
Hedera Hashgraph (HBAR) is showing notable strength with historic high volumes, aligning with my previous long-term bullish outlook:
However, some pullback around the April 2024 high could be expected in the short term, although there remains potential for further upward movement earlier next week.
Should a significant retracement occur, targets could be within the 0.105-0.09 range into the 4-hour FVG, or less likely but potentially down to the previous key level of 0.06 to eliminate any FOMO, high leveraged, inexperienced or whatever exit-liquidity-for-whales longs.
My DCA from last year is around 0.05, and in hindsight, I regret not purchasing more at that price level. Hence, this analysis is admittedly influenced by my personal sentiment.

HBARUSD - Awhile for a Big Bull MoveI think price will trend under the red dotted line for quite awhile but then a breakout above will occur. This is a great buy signal this break upwards.
ATH's will be smashed on this daily timeframe it just might take some time imo as price tries to find its way above the red dotted line.

Hbar RetestHBar just broke above the .15 mark. Touch .17 and now is coming down for a retest of the .15. Hbar is bullish and should see .20 for the next move up.
HBAR BULLFLAG SUPPORT TO 0.35If HBAR can find solid support at .12 and break past the .14 cent liquidation barrier we have relatively clear skies to 0.35 it takes baby steps but more importantly, the bulls to outbeat the sellers and clear some liquidity past .14

HBARUSD: Turned parabolic but you can still catch a buy.Hedera turned overbought on its 1D technical outlook (RSI = 73.246, MACD = 0.018, ADX = 60.152) as it is rising non-stop since the November 5th bottom and is about to reach the April 23rd High. The 1W RSI is almost overbought as well and when that happened on the previous Cycle as HBAR was coming off a Falling Wedge, the price turned parabolic on a +1,538% rise, reaching the 2.618 Fibonacci extension.
Now that Fib is significantly higher but may still hit it in 2025 but on a more immediate horizon, we can target the full extent of the +1,538% rise (TP = 0.68000). The 1D MA50 is expected to support until then, following the expected formation of the 1D Golden Cross.
## If you like our free content follow our profile to get more daily ideas. ##
## Comments and likes are greatly appreciated. ##

A Crypto on a journey from bigger Time-F's & Big move-up
I have been following HBARUSD for a bit over a week. I was wondering why it was getting huge volumes lately. Hidden away on higher time frames 'monthly' & 'weekly' charts reveals the reasons volume and buying is on increase.
Price breaking out of a triangle on Monthly chart very, very recently and price moving back to retest this breakout and give buyers another opportunity at the better price.
Weekly chart is a Top 2 and price snapping back to retest the Top of this system.
A good trade with a longer term view, or cash in on the short term with its volatility supportive of long prices.

HBAR: $0.051 | an Enterprise Solution ahead of its Timefinding value in this brave new world is a matter of a conviction experience and discipline
this project is for keeps.. secure capital and leave the rest to maybe $100bn to $1trilioin cap
when it becomes the facility to digitize Fortune 500 hard assets
it covers the usual payments nfts defi etc..
what sets this apart is the team and project updates which is BORING for most
yet golden for serious investors
the IDNTITY project may just be a goldmine
however it needs to peddle a flagship project to win new investors
under rated forgotten yet a sleeping giant that can dazzle at TOP 10 by next cycle

The Future of Hedera Hashgraph SpeculatedI must admit that the bearish prediction for Bitcoin and the entire crypto market has been completely invalidated. I now consider the 130k-140k scenario for BTCUSD, which I suggested as a candidate in my previous analysis, more likely.
Previous Analysis:
With President Trump's re-election, the crypto market is in a good position fundamentals-wise.
On that premise, let's imagine a fun dream typical of cryptocurrency holders. As a holder and fan of Hedera Hashgraph (HBAR), I will focus on this token, but many analysts would agree that utility tokens that succeed in the future will follow a similar path.
Here, I envision a scenario where HBAR struggles to break through around 1.1 USD, then shows a substantial uptick, followed by a retracement around 2.2-2.3 USD. In this cycle, it is possible to envision a final target of around 15 USD. Of course, this is not the end for this token, and there could be a future where it grows exponentially beyond that: essentially, it will achieve 10x from the recent bottom with ease, showing inevitable growth up to 20x and even a dream-like future of 300x, which is at least possible TA-wise to construct.
This is a long-term scenario, assuming that the low of 0.36 USD does not break. In the short term, it is more natural to think that some buyers will start closing positions and securing profits from the recent breakout, specifically considering a return to around 0.69-0.59 USD.
Although holders and fans need no explanation, even a little research on Hedera Hashgraph reveals how it is following a normative path of growth toward what is envisioned as the future of distributed ledger technology.
And there, instead of speculative money games under the guise of "value preservation," there is an opportunity for investment in technological innovation supported by actual demand—a perspective that few would oppose.

Hedera Hashgraph, HBAR, golden pocket algo target $1.54, 17xdid you hear that? idk, something about transactions in space?
another golden pocket special. its a bit late now, never like entering on a pump its a lot harder to set a decent stop. feels much better entering on the dip...
See linked BTC chart for why my charts are so bull.
The Trade:
Preferred Entry: $0.0453 or a 0.168 retrace of this impulse wave (if we get one)
Ape Entry: $0.0837
Stop: $0.041 / $0.0531
Resistance: $0.167 - order block + bear golden pocket.
Target: $1.54 - 17x
D.Y.O.R. DO NOT BLINDLY TAKE THESE TRADES.
Never Trust. Verify. PLEASE DO YOUR OWN ANALYSIS.
This is not financial advice. These are just my observations.
Technical Analysis is not about being right, it's about increasing your odds.
Be prepared to be wrong. Risk management is key. Capital preservation above all else.

HBAR UPHello there.
Hbar idea.
Here, we can see a very strong movement for an uptrend. The hard resistance is showed by the line.
But we have cleary an uptrend with the break of the EMA 50 of Weekly.
This candle is important, so a fast consolidation is possible. Put your order on the EMA50 Weekly (0.70-0.75) if this happen to catch the uptrend continuation.
If rejection of resistance : same move.
Target 1 : 0.17
Target 2 : 0.45
Target 3 : 1
Target 4 : 2.31
Good luck.

Next hbar targetSend it. Lot of demand for the US based Cryptos all the sudden, why do ya suppose that is? *not financial advice*

hederaHedera is a decentralized, open-source, proof-of-stake public ledger that utilizes the leaderless, asynchronous Byzantine Fault Tolerance (aBFT) hashgraph consensus algorithm. It is governed by a collusion-resistant, decentralized council of leading enterprises, universities, and web3 projects from around the world.
CRYPTOCAP:HBAR
