Hedera Update · Keep Holding · No Selling, YetHedera (HBAR) looks awesome. The action and chart right now is one of the best in the market. I love the fact that the candles are moving straight up. This can be equated to how FUN Token (FUN) has been performing in the past month. What one does, the rest follows.
The most interesting signal comes
Related pairs

HBAR Game Plan: Short the Bounce, Long the Liquidity GrabHBAR has been moving strongly and is currently offering both short and long trade opportunities based on a clean potential ABC corrective pattern, key fib levels, volume profile, and anchored VWAP. Let’s break down the setup.
🧩 Technical Breakdown
Higher Timeframe Confluence:
0.618 fib retrac

Can Hedera Hashgrap sustain the breakout for 17% gains to $0.27?Hello✌
Let’s analyze Hedera Hashgraph’s upcoming price potential 📈.
BINANCE:HBARUSDT has broken above multiple daily resistance levels and is now holding near a strong Fibonacci support and daily demand zone 📊. This setup suggests a potential upside of around 17%, with a primary target at 0.27

Hedera (HBAR): Waiting For Break of Structure (BOS) | BULLISHWe are bullish as soon as we hit that BOS near the local EMAs, which will confirm our buy-side trading setup.
Now there is one thing that concerns us, that being the huge CME gap below our local lows on current timeframes, so it is very important here to wait for that BOS before entering into long

HBARUSDT Forming Bullish BreakoutHBARUSDT is showing strong signs of a potential bullish trend as it pushes higher with increased momentum. The recent breakout on the daily chart confirms that buyers are stepping in with confidence, supported by a good surge in volume. This uptick in activity is drawing fresh attention from traders

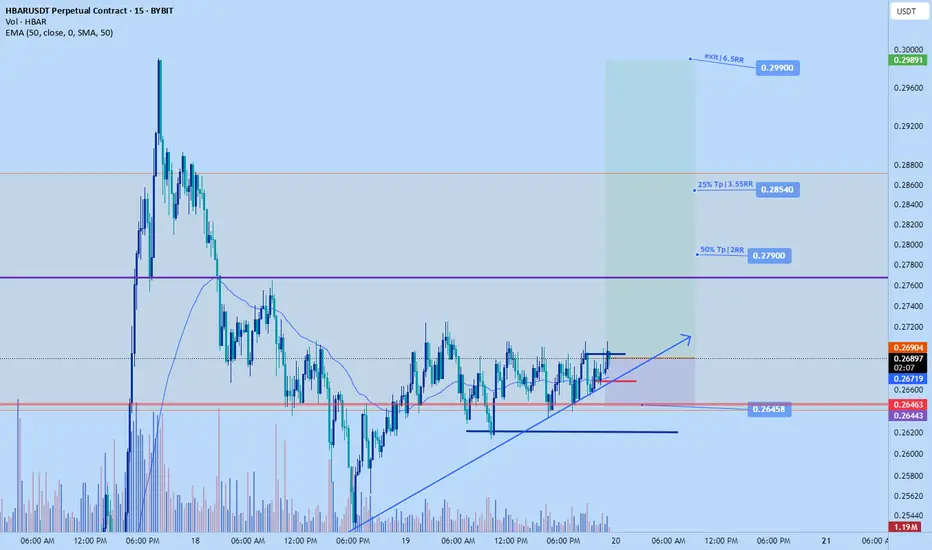
Hbar pump $0.279+Just recently opened a long position on hbar. Aiming for 0.279 to 0.299
Time sensitive. Based on my DTT analysis breakout to the upside likely to happen any moment now
SL: $0.26458 or lower
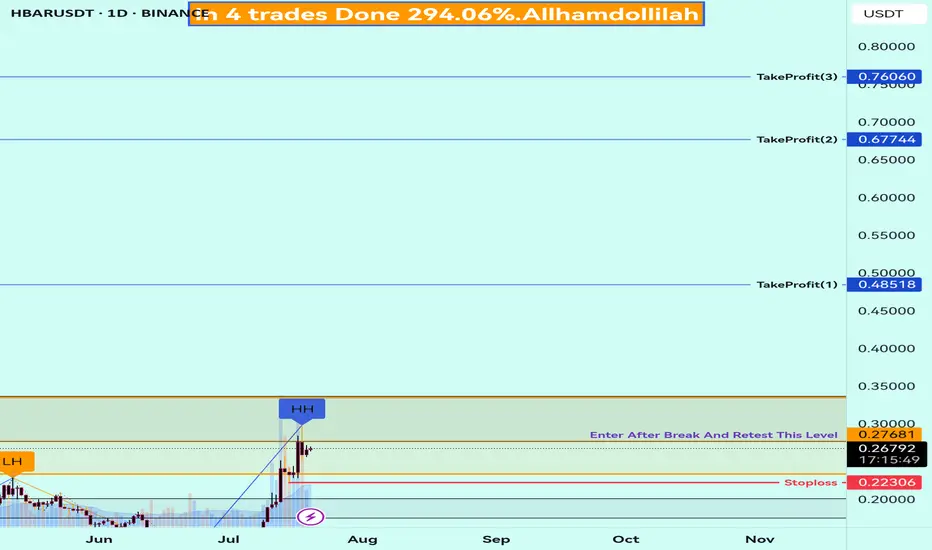
Buy Trade Strategy for HBAR: Backing Enterprise-Grade DLT AdoptiDescription:
This trading idea is centered on HBAR, the native token of Hedera Hashgraph, a next-generation distributed ledger technology (DLT) designed for speed, security, and scalability. Unlike traditional blockchains, HBAR uses a unique hashgraph consensus mechanism, making it exceptionally ef
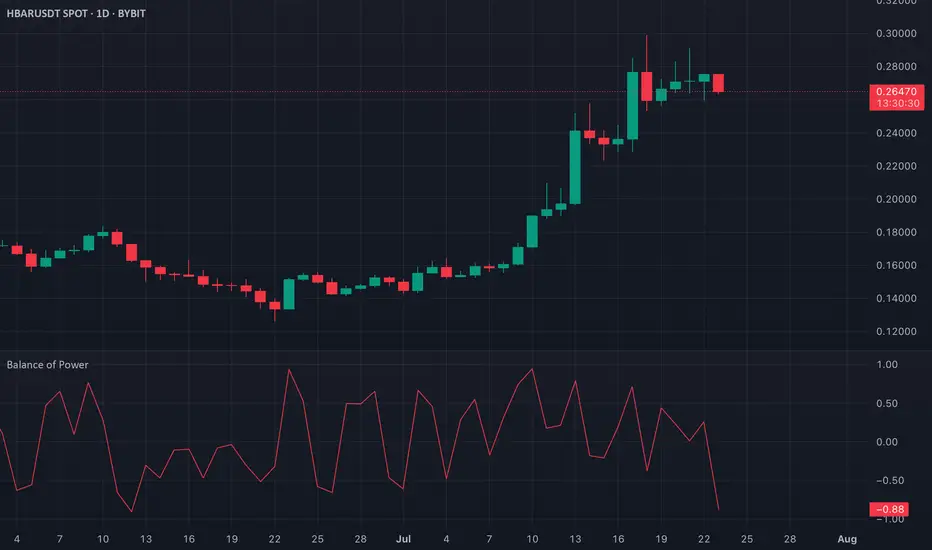
HBAR BoP Turns Negative, Signaling Bearish Momentum ShiftHBAR's Balance of Power (BoP) indicator has recently flipped negative, currently reading -0.87. This suggests a shift in market sentiment, with selling pressure outweighing buying interest. The BoP is a momentum indicator that gauges the strength between buyers and sellers, and a negative value like
HBAR UP - Bullish Retest for Trend ContinuationThis long trade setup is based on Hedera (HBAR) showing significant strength after a strong bounce from the major long-term support zone around $0.15. The price has successfully broken out above key momentum indicators, including the 9-day SMA and the daily VWAP.
The current price action represents
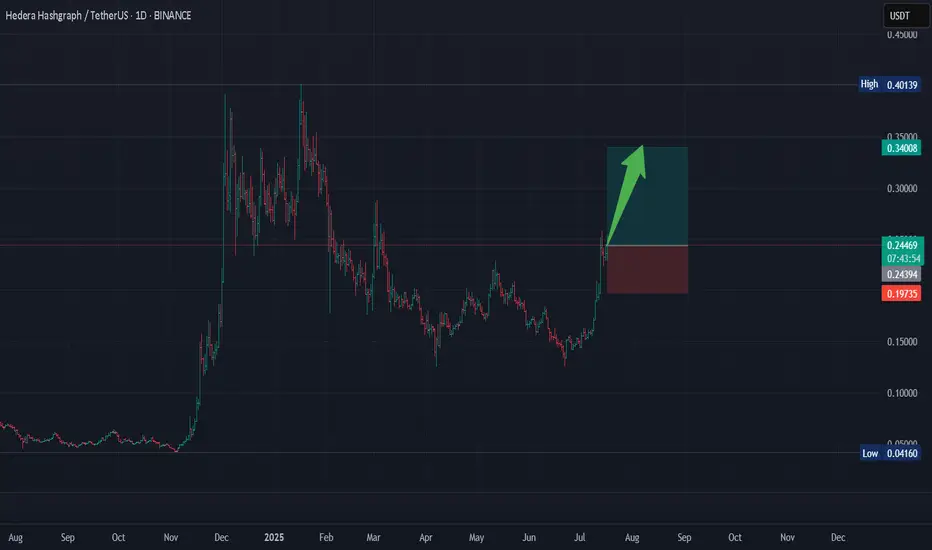
HBAR Is About to Melt Faces!I see a powerful reversal coming on HBAR due to a breakout from this falling wedge pattern. A new high above the $0.35 resistance should be coming soon. I’m bullish!
As always, stay profitable.
– Dalin Anderson

See all ideas
Summarizing what the indicators are suggesting.
Oscillators
Neutral
SellBuy
Strong sellStrong buy
Strong sellSellNeutralBuyStrong buy
Oscillators
Neutral
SellBuy
Strong sellStrong buy
Strong sellSellNeutralBuyStrong buy
Summary
Neutral
SellBuy
Strong sellStrong buy
Strong sellSellNeutralBuyStrong buy
Summary
Neutral
SellBuy
Strong sellStrong buy
Strong sellSellNeutralBuyStrong buy
Summary
Neutral
SellBuy
Strong sellStrong buy
Strong sellSellNeutralBuyStrong buy
Moving Averages
Neutral
SellBuy
Strong sellStrong buy
Strong sellSellNeutralBuyStrong buy
Moving Averages
Neutral
SellBuy
Strong sellStrong buy
Strong sellSellNeutralBuyStrong buy
Displays a symbol's price movements over previous years to identify recurring trends.
Frequently Asked Questions
The current price of Hedera / Tether US (HBAR) is 0.269939 USDT — it has risen 9.95% in the past 24 hours. Try placing this info into the context by checking out what coins are also gaining and losing at the moment and seeing HBAR price chart.
Hedera / Tether US price has fallen by −5.16% over the last week, its month performance shows a 70.10% increase, and as for the last year, Hedera / Tether US has increased by 310.10%. See more dynamics on HBAR price chart.
Keep track of coins' changes with our Crypto Coins Heatmap.
Keep track of coins' changes with our Crypto Coins Heatmap.
Hedera / Tether US (HBAR) reached its highest price on Jan 17, 2025 — it amounted to 0.401276 USDT. Find more insights on the HBAR price chart.
See the list of crypto gainers and choose what best fits your strategy.
See the list of crypto gainers and choose what best fits your strategy.
Hedera / Tether US (HBAR) reached the lowest price of 0.035621 USDT on Dec 31, 2022. View more Hedera / Tether US dynamics on the price chart.
See the list of crypto losers to find unexpected opportunities.
See the list of crypto losers to find unexpected opportunities.
The safest choice when buying HBAR is to go to a well-known crypto exchange. Some of the popular names are Binance, Coinbase, Kraken. But you'll have to find a reliable broker and create an account first. You can trade HBAR right from TradingView charts — just choose a broker and connect to your account.
Crypto markets are famous for their volatility, so one should study all the available stats before adding crypto assets to their portfolio. Very often it's technical analysis that comes in handy. We prepared technical ratings for Hedera / Tether US (HBAR): today its technical analysis shows the buy signal, and according to the 1 week rating HBAR shows the strong buy signal. And you'd better dig deeper and study 1 month rating too — it's strong buy. Find inspiration in Hedera / Tether US trading ideas and keep track of what's moving crypto markets with our crypto news feed.
Hedera / Tether US (HBAR) is just as reliable as any other crypto asset — this corner of the world market is highly volatile. Today, for instance, Hedera / Tether US is estimated as 6.74% volatile. The only thing it means is that you must prepare and examine all available information before making a decision. And if you're not sure about Hedera / Tether US, you can find more inspiration in our curated watchlists.
You can discuss Hedera / Tether US (HBAR) with other users in our public chats, Minds or in the comments to Ideas.