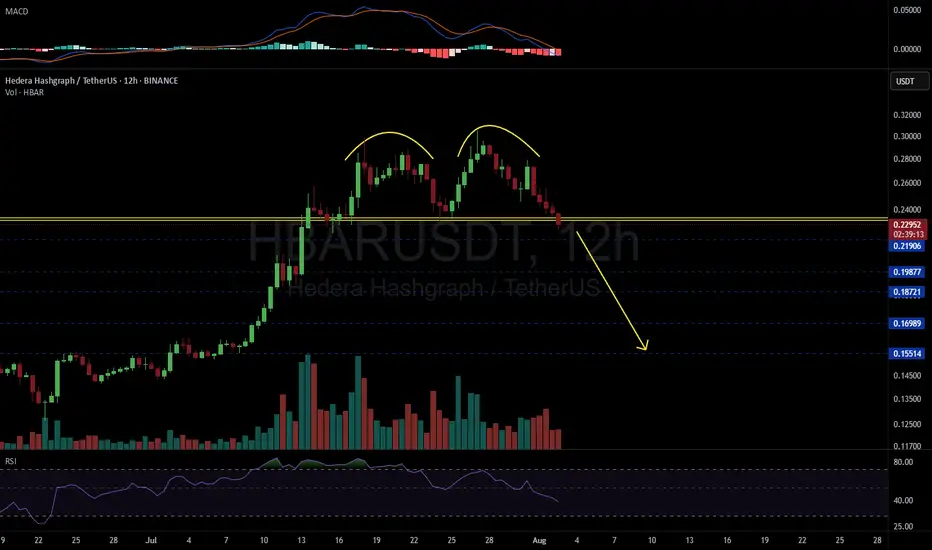
HBARUSDT 12H#HBAR has formed a Double Top pattern on the 12H timeframe and has now broken below the neckline.
If this candle and the next one close below the neckline, the pattern will be confirmed and we could see further downside toward the following support levels:
🎯 $0.21906
🎯 $0.19877
🎯 $0.18721
🎯 $0.16989
🎯 $0.15514
⚠️ As always, use a tight stop-loss and apply proper risk management.
HBARUSDT trade ideas
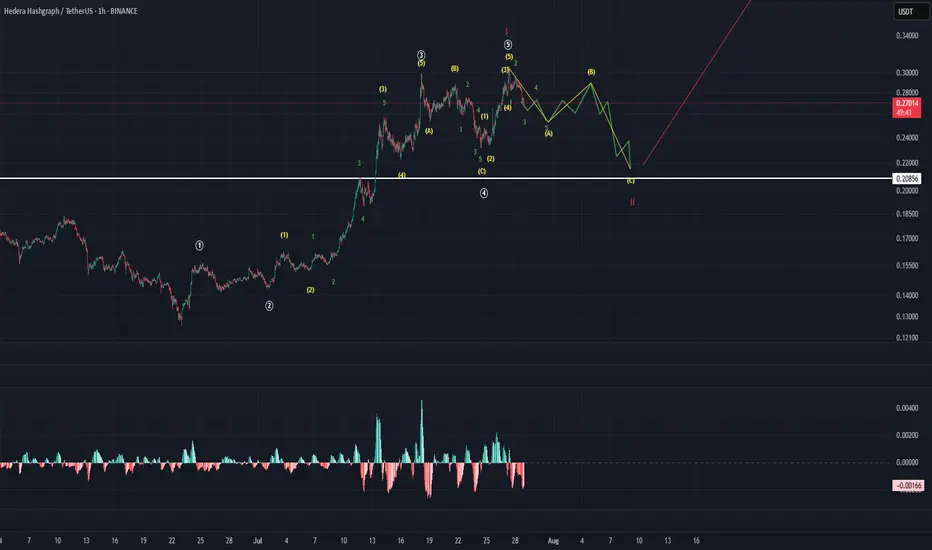
Hedera 2025 All-Time High · Simple Analysis Bullish ConfirmedHedera is about to close five weeks green. Five weeks green and we only have a minor advance, relatively speaking. Some 100%. Back in late 2024 five weeks green resulted in more than 800% growth. Huge difference, but after the fifth week growth stopped. This time it will be different.
We already have five weeks of bullish action and this is only portion of the entire bullish period, just a small part. This can continue for months, then a stop and one final jump. Or this can start now and just keep on going until it peaks and that's it, nor more growth until the next bullish phase. So we would see a bear market after the completion of the bull market and the only bullish action would be corrections within the bear market. Right now market conditions are extremely bullish.
We have a long-term lower high. In early 2025 the action peaked below the 2021 all-time high. The wave that is developing now will break this barrier and produce a new all-time high. This is very easy to predict, market conditions are bullish.
The interesting part will be to see how far up Hedera will go. We can use this project, since it is definitely going to be one of the first to peak, to know how the rest of the market will perform. Easy we have between 200% and 400% potential for growth.
I hope you are being entertained and I really hope you enjoy the content. If you do, give me a follow @MasterAnanda
Namaste.

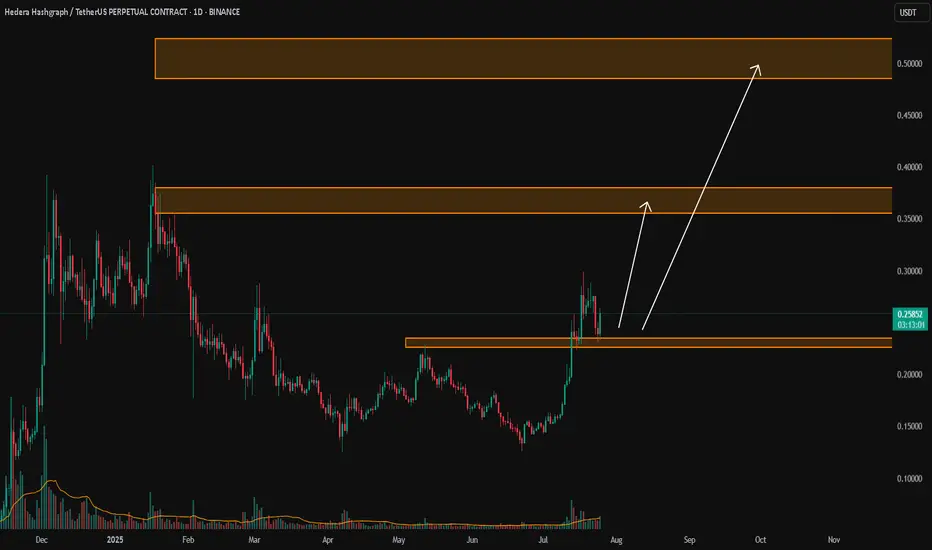
HBARUSDT – Planning Ahead, Not Reacting Late In the event of a potential Q3 correction, I believe HBARUSDT could revisit the green box zones below.
These areas aren’t guaranteed bounce points — but they represent fair value in a market pullback scenario.
🧭 How I’m Preparing
📌 No blind orders
📌 Set alerts at the green zones
📌 When price hits, switch to 1-hour
📌 Wait for upward breakout + rising CDV
If it aligns, I take the trade — one bullet only.
"The smart investor doesn’t fear the correction — they prepare for it."
No rush. No panic. Just discipline.
Let’s stay ready.
— UmutTrades 💙
📌I keep my charts clean and simple because I believe clarity leads to better decisions.
📌My approach is built on years of experience and a solid track record. I don’t claim to know it all but I’m confident in my ability to spot high-probability setups.
📌If you would like to learn how to use the heatmap, cumulative volume delta and volume footprint techniques that I use below to determine very accurate demand regions, you can send me a private message. I help anyone who wants it completely free of charge.
🔑I have a long list of my proven technique below:
🎯 ZENUSDT.P: Patience & Profitability | %230 Reaction from the Sniper Entry
🐶 DOGEUSDT.P: Next Move
🎨 RENDERUSDT.P: Opportunity of the Month
💎 ETHUSDT.P: Where to Retrace
🟢 BNBUSDT.P: Potential Surge
📊 BTC Dominance: Reaction Zone
🌊 WAVESUSDT.P: Demand Zone Potential
🟣 UNIUSDT.P: Long-Term Trade
🔵 XRPUSDT.P: Entry Zones
🔗 LINKUSDT.P: Follow The River
📈 BTCUSDT.P: Two Key Demand Zones
🟩 POLUSDT: Bullish Momentum
🌟 PENDLEUSDT.P: Where Opportunity Meets Precision
🔥 BTCUSDT.P: Liquidation of Highly Leveraged Longs
🌊 SOLUSDT.P: SOL's Dip - Your Opportunity
🐸 1000PEPEUSDT.P: Prime Bounce Zone Unlocked
🚀 ETHUSDT.P: Set to Explode - Don't Miss This Game Changer
🤖 IQUSDT: Smart Plan
⚡️ PONDUSDT: A Trade Not Taken Is Better Than a Losing One
💼 STMXUSDT: 2 Buying Areas
🐢 TURBOUSDT: Buy Zones and Buyer Presence
🌍 ICPUSDT.P: Massive Upside Potential | Check the Trade Update For Seeing Results
🟠 IDEXUSDT: Spot Buy Area | %26 Profit if You Trade with MSB
📌 USUALUSDT: Buyers Are Active + %70 Profit in Total
🌟 FORTHUSDT: Sniper Entry +%26 Reaction
🐳 QKCUSDT: Sniper Entry +%57 Reaction
📊 BTC.D: Retest of Key Area Highly Likely
📊 XNOUSDT %80 Reaction with a Simple Blue Box!
📊 BELUSDT Amazing %120 Reaction!
📊 Simple Red Box, Extraordinary Results
📊 TIAUSDT | Still No Buyers—Maintaining a Bearish Outlook
📊 OGNUSDT | One of Today’s Highest Volume Gainers – +32.44%
📊 TRXUSDT - I Do My Thing Again
📊 FLOKIUSDT - +%100 From Blue Box!
📊 SFP/USDT - Perfect Entry %80 Profit!
📊 AAVEUSDT - WE DID IT AGAIN!
I stopped adding to the list because it's kinda tiring to add 5-10 charts in every move but you can check my profile and see that it goes on..

Hbar dump to $0.22904Just now opened up a short position on hbar.
Sl: $0.24598
Tp: $0.22904
Roughly 2RR from my entry.

HBAR: Capitulation - A Major Bottom and High-Reward LongToday we're looking at Hedera (HBAR), which has just experienced a waterfall decline, breaking key structural levels in a classic capitulation event. While the immediate trend is aggressively bearish, these are the exact conditions that often precede major market bottoms and powerful V-shaped recoveries.
This analysis will break down the overwhelming evidence of seller exhaustion and why the current level presents a rare, high-reward opportunity for a counter-trend long position, targeting a significant rally.
The Analysis: The Case for a Generational Bottom
Trading against a strong trend is inherently risky, but the data becomes compelling when a market reaches a state of extreme, multi-timeframe exhaustion. Here is the confluence of signals pointing to a major bottom on HBAR:
1. CRITICAL - The Capitulation Signal (Widespread Oversold Conditions):
This is the single most important factor. Our momentum dashboard is showing a profound alignment of exhaustion: the 30M, 1H, 4H, and—most importantly—the Daily timeframes are all simultaneously deep in "Oversold" territory. When the daily chart signals this level of exhaustion, it's often a sign of a macro trend pivot, not just a minor bounce. This is a textbook signal of seller capitulation.
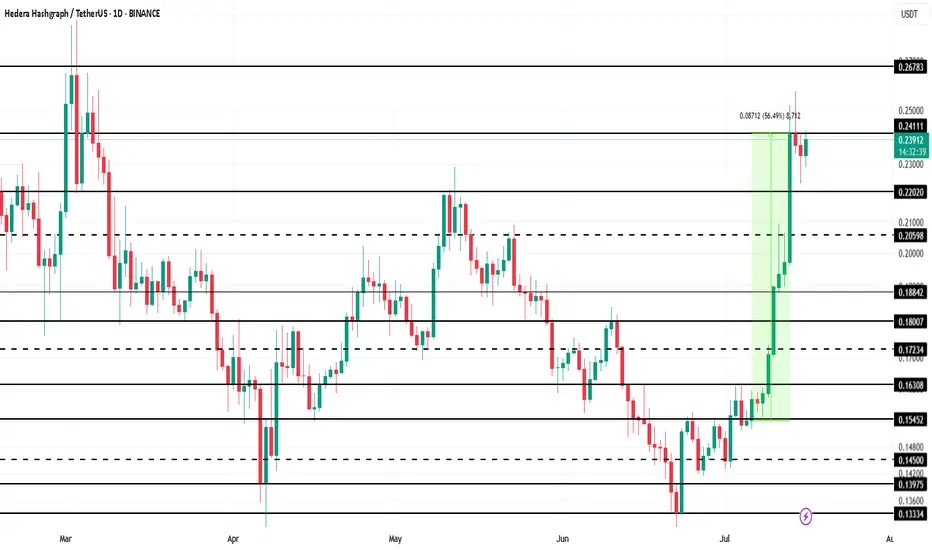
2. The Time-Based Pivot (Fibonacci Time Cycle):
Adding a powerful, non-price-based confluence is the appearance of a Fibonacci Time Cycle (the purple lightning bolt) precisely at the recent low. These cycles often mark temporal points where a trend exhausts itself. The alignment of extreme oversold price conditions with a time-based pivot point is a very strong indication that a turn is imminent.
3. Test of Major Dynamic Support (EMA 400):
The price found its footing and is starting to bounce from the vicinity of the EMA 400. This long-term moving average is a significant level that often acts as a major floor for price during larger corrective moves within a macro uptrend.
4. Highly Asymmetric Risk-to-Reward Profile:
This is a classic high-reward setup. By entering near the absolute lows, a trader can define their risk with a very tight stop loss. The potential upside, however, is substantial. A recovery would first target the Daily Open and then potentially the previous highs, creating a scenario where the potential reward vastly outweighs the defined risk.
The Potential Trade Plan
This is an aggressive but calculated trade plan designed to capture the beginning of a potential new bullish impulse from a point of maximum fear.
Entry Zone: The current price area represents the point of maximum opportunity. Look for signs of a base forming as buyers begin to step in.
Stop Loss: A very tight stop loss can be placed just below the absolute low at $0.25800. A break of this level would invalidate the immediate reversal thesis.
Potential Targets:
Target 1: A reclaim of the Daily Open / Psy-Lo level around $0.2715 - $0.2750.
Target 2: The major swing high and Psy-Hi level at $0.30500, which would represent a full V-shaped recovery.
Conclusion
While the recent price action has been extremely bearish, the confluence of signals—a rare multi-timeframe oversold condition, a time-based pivot point, and a test of major long-term support—points towards a potential major market bottom. For traders willing to take on calculated risk, the current levels on HBAR offer a compelling, high-reward opportunity to catch what could be the start of the next major rally.
Disclaimer:
This analysis is for educational purposes only and is not financial advice. Trading involves a high level of risk, especially when attempting to trade against a strong trend. Always conduct your own thorough research and consult with a licensed financial advisor before making any trading decisions.

Buy HBARHBAR is the native cryptocurrency of the Hedera network, a high-performance, enterprise-grade public blockchain alternative that uses a unique consensus algorithm called Hashgraph.
Governed by a 39-member global Governing Council, including:Google, IBM, Boeing, Dell, Ubisoft, Deutsche Telekom. These members run nodes and vote on governance, making the network decentralized, but enterprise-friendly.
HBAR still in the box formed since January 2021 but it has potential to break-out. Actually, the first leg-up has started and curently price is consolidating before the second legup. with potential to break out the box.
Trade setup is as in chart Target is estimated based on market cap of 11B.

Hedera (HBAR): Buyers Pushing For Breakout | Good Buy EntryHedera is loading up for a breakout here, which might give us a good R:R trade if executed properly.
What we are looking for is a proper breakout where buyers maintain the dominance in that region, after which our target is going to be the resistance zone and 200EMA line.
Swallow Academy

HBARSimiliar scenario to BYBIT:BTCUSDT.P just have to wait for the daily close.
I marked out a potential entry are with the red line, which is a 4H order block which COULD be tapped
Again I will update you on my entry ASAP
Do not forget to follow and like, it helps me alot.
Stay blessed

HBAR Game Plan: Short the Bounce, Long the Liquidity GrabHBAR has been moving strongly and is currently offering both short and long trade opportunities based on a clean potential ABC corrective pattern, key fib levels, volume profile, and anchored VWAP. Let’s break down the setup.
🧩 Technical Breakdown
Higher Timeframe Confluence:
0.618 fib retracement from the macro move
1.618 trend-based fib extension
1.272 VWAP band resistance
Point of Control (POC) from the visible range profile
This is marked as a major take profit/short opportunity zone.
For extra confluence, the negative fib extension golden pocket (-0.618 to -0.666) also aligns right at this resistance zone
Current Structure:
We’re potentially completing wave B of an ABC corrective move
Price has retraced into a high-probability short zone
🔴 Short Setup
Entry Zone:
Between the 0.702 and 0.786 fib retracement levels
Why Here?
0.702–0.786 fib retracement → short zone for reversals
Potential wave B top → setting up for a C leg down
Target (TP):
Around $0.25–$0.24, near the expected wave C completion
🟢 Long Setup
Entry Zone:
~$0.25–$0.24 area.
Why Here?
This zone is a strong confluence area:
➡️ 0.786 fib retracement
➡️ 1.0 trend-based fib extension of ABC
➡️ Anchored VWAP from the entire trend, offering dynamic support
➡️ Liquidity pool
➡️ Previous weekly Open
Plan:
Wait for price to complete wave C into this zone, then look for bullish reaction signs to enter long.
💡 Educational Insight
Why the 0.702–0.786 short zone?
These fib levels are often overlooked but are key “hidden” zones where wave B tops out before C waves.
Why anchored VWAP?
Anchored VWAP gives you dynamic institutional support/resistance, especially when aligned with fibs and liquidity.
Why wait for confirmation?
Blindly longing or shorting levels can trap you. Wait for SFPs, wick rejections, or lower timeframe structure flips to boost trade probability.
Final Thoughts
HBAR is in a highly interesting zone, offering both:
A short setup into the C wave,
And a long setup at the C wave completion, backed by multiple confluence factors.
Let the levels come to you and wait for confirmation!
_________________________________
💬 If you found this helpful, drop a like and comment!
Want breakdowns of other charts? Leave your requests below.

Hedera (HBAR): Waiting For Break of Structure (BOS) | BULLISHWe are bullish as soon as we hit that BOS near the local EMAs, which will confirm our buy-side trading setup.
Now there is one thing that concerns us, that being the huge CME gap below our local lows on current timeframes, so it is very important here to wait for that BOS before entering into long here, so let's wait.
Swallow Academy

HYPE LongFollowing a significant decline, the asset will take support and bounce back from this point.
Disclaimer: This is not financial advice.
This algorithm provides highly precise buy and sell signals with alerts:

HBAR/USDTKey Level Zone: 0.22600 - 0.23500
LMT v2.0 detected.
The setup looks promising—price previously trended upward with rising volume and momentum, then retested this zone cleanly. This presents an excellent reward-to-risk opportunity if momentum continues to align.
Introducing LMT (Levels & Momentum Trading)
- Over the past 3 years, I’ve refined my approach to focus more sharply on the single most important element in any trade: the KEY LEVEL.
- While HMT (High Momentum Trading) served me well—combining trend, momentum, volume, and structure across multiple timeframes—I realized that consistently identifying and respecting these critical price zones is what truly separates good trades from great ones.
- That insight led to the evolution of HMT into LMT – Levels & Momentum Trading.
Why the Change? (From HMT to LMT)
Switching from High Momentum Trading (HMT) to Levels & Momentum Trading (LMT) improves precision, risk control, and confidence by:
- Clearer Entries & Stops: Defined key levels make it easier to plan entries, stop-losses, and position sizing—no more guesswork.
- Better Signal Quality: Momentum is now always checked against a support or resistance zone—if it aligns, it's a stronger setup.
- Improved Reward-to-Risk: All trades are anchored to key levels, making it easier to calculate and manage risk effectively.
- Stronger Confidence: With clear invalidation points beyond key levels, it's easier to trust the plan and stay disciplined—even in tough markets.
Whenever I share a signal, it’s because:
- A high‐probability key level has been identified on a higher timeframe.
- Lower‐timeframe momentum, market structure and volume suggest continuation or reversal is imminent.
- The reward‐to‐risk (based on that key level) meets my criteria for a disciplined entry.
***Please note that conducting a comprehensive analysis on a single timeframe chart can be quite challenging and sometimes confusing. I appreciate your understanding of the effort involved.
Important Note: The Role of Key Levels
- Holding a key level zone: If price respects the key level zone, momentum often carries the trend in the expected direction. That’s when we look to enter, with stop-loss placed just beyond the zone with some buffer.
- Breaking a key level zone: A definitive break signals a potential stop‐out for trend traders. For reversal traders, it’s a cue to consider switching direction—price often retests broken zones as new support or resistance.
My Trading Rules (Unchanged)
Risk Management
- Maximum risk per trade: 2.5%
- Leverage: 5x
Exit Strategy / Profit Taking
- Sell at least 70% on the 3rd wave up (LTF Wave 5).
- Typically sell 50% during a high‐volume spike.
- Move stop‐loss to breakeven once the trade achieves a 1.5:1 R:R.
- Exit at breakeven if momentum fades or divergence appears.
The market is highly dynamic and constantly changing. LMT signals and target profit (TP) levels are based on the current price and movement, but market conditions can shift instantly, so it is crucial to remain adaptable and follow the market's movement.
If you find this signal/analysis meaningful, kindly like and share it.
Thank you for your support~
Sharing this with love!
From HMT to LMT: A Brief Version History
HM Signal :
Date: 17/08/2023
- Early concept identifying high momentum pullbacks within strong uptrends
- Triggered after a prior wave up with rising volume and momentum
- Focused on healthy retracements into support for optimal reward-to-risk setups
HMT v1.0:
Date: 18/10/2024
- Initial release of the High Momentum Trading framework
- Combined multi-timeframe trend, volume, and momentum analysis.
- Focused on identifying strong trending moves high momentum
HMT v2.0:
Date: 17/12/2024
- Major update to the Momentum indicator
- Reduced false signals from inaccurate momentum detection
- New screener with improved accuracy and fewer signals
HMT v3.0:
Date: 23/12/2024
- Added liquidity factor to enhance trend continuation
- Improved potential for momentum-based plays
- Increased winning probability by reducing entries during peaks
HMT v3.1:
Date: 31/12/2024
- Enhanced entry confirmation for improved reward-to-risk ratios
HMT v4.0:
Date: 05/01/2025
- Incorporated buying and selling pressure in lower timeframes to enhance the probability of trending moves while optimizing entry timing and scaling
HMT v4.1:
Date: 06/01/2025
- Enhanced take-profit (TP) target by incorporating market structure analysis
HMT v5 :
Date: 23/01/2025
- Refined wave analysis for trending conditions
- Incorporated lower timeframe (LTF) momentum to strengthen trend reliability
- Re-aligned and re-balanced entry conditions for improved accuracy
HMT v6 :
Date : 15/02/2025
- Integrated strong accumulation activity into in-depth wave analysis
HMT v7 :
Date : 20/03/2025
- Refined wave analysis along with accumulation and market sentiment
HMT v8 :
Date : 16/04/2025
- Fully restructured strategy logic
HMT v8.1 :
Date : 18/04/2025
- Refined Take Profit (TP) logic to be more conservative for improved win consistency
LMT v1.0 :
Date : 06/06/2025
- Rebranded to emphasize key levels + momentum as the core framework
LMT v2.0
Date: 11/06/2025
- Fully restructured lower timeframe (LTF) momentum logic
Can Hedera Hashgrap sustain the breakout for 17% gains to $0.27?Hello✌
Let’s analyze Hedera Hashgraph’s upcoming price potential 📈.
BINANCE:HBARUSDT has broken above multiple daily resistance levels and is now holding near a strong Fibonacci support and daily demand zone 📊. This setup suggests a potential upside of around 17%, with a primary target at 0.27 🚀. Monitoring volume and price action near support will be key for continuation.
✨ Need a little love!
We pour love into every post your support keeps us inspired! 💛 Don’t be shy, we’d love to hear from you on comments. Big thanks , Mad Whale 🐋

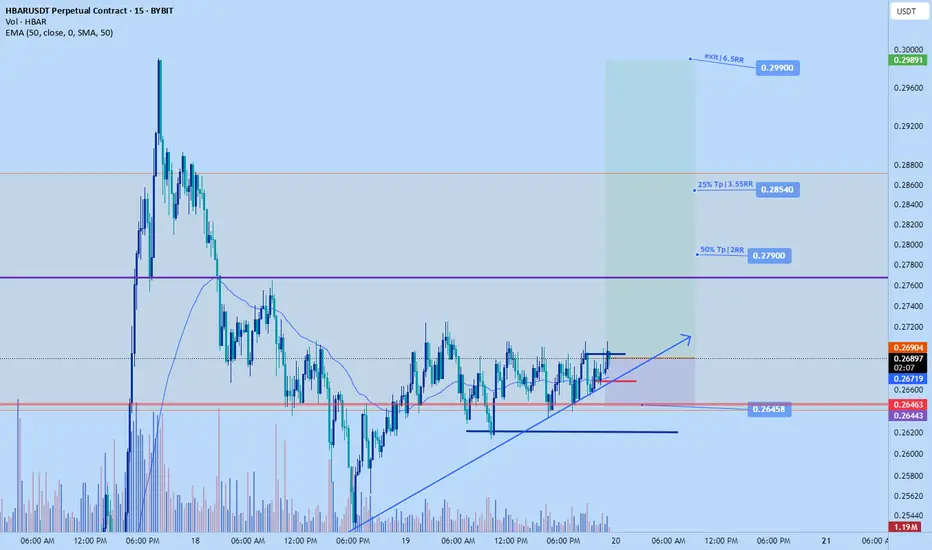
Hbar pump $0.279+Just recently opened a long position on hbar. Aiming for 0.279 to 0.299
Time sensitive. Based on my DTT analysis breakout to the upside likely to happen any moment now
SL: $0.26458 or lower
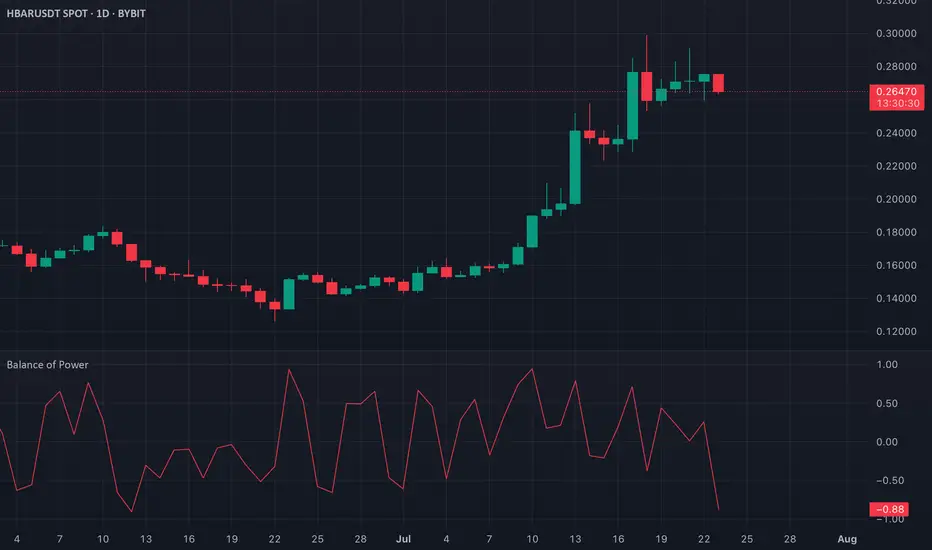
HBAR BoP Turns Negative, Signaling Bearish Momentum ShiftHBAR's Balance of Power (BoP) indicator has recently flipped negative, currently reading -0.87. This suggests a shift in market sentiment, with selling pressure outweighing buying interest. The BoP is a momentum indicator that gauges the strength between buyers and sellers, and a negative value like this typically signals that bears are in control.
This bearish turn in the BoP reflects a waning demand for HBAR and could indicate further downside risk unless buying momentum returns. Traders may want to remain cautious in the short term as this shift could mark the beginning of a broader correction or continued weakness.
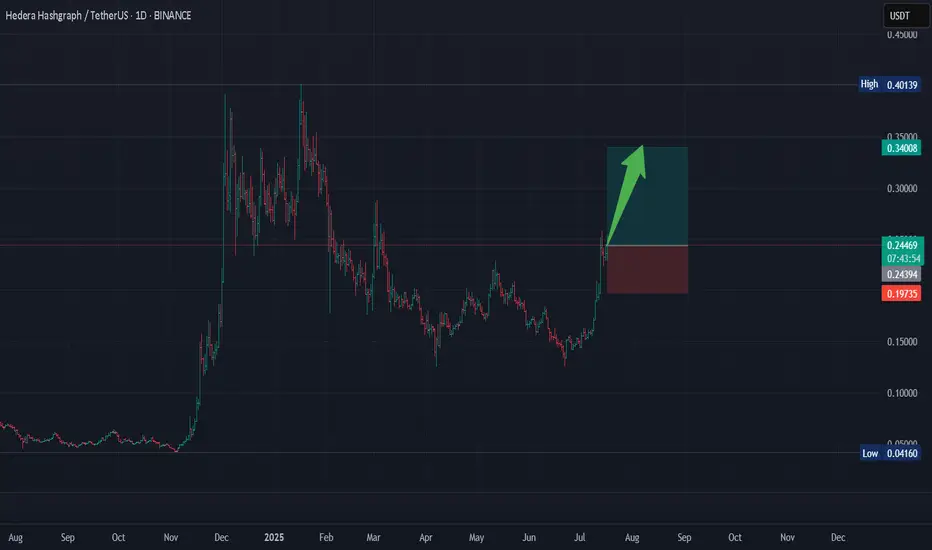
Hedera Update · Keep Holding · No Selling, YetHedera (HBAR) looks awesome. The action and chart right now is one of the best in the market. I love the fact that the candles are moving straight up. This can be equated to how FUN Token (FUN) has been performing in the past month. What one does, the rest follows.
The most interesting signal comes from MA200. Trading is happening above this level and that's all we need to know. When HBARUSDT broke above it, any bullish potential and bullish signals become fully confirmed. It is not a question of "if" anymore but instead a done deal. Growth is expected to happen for a period ranging between 3-6 months once this signal shows up.
This means you can see a strong retrace in a month and still, you remain calm and hold because you know higher prices are still possible. This means that if you see a correction after three months, you can take profits of course but still know that the top is not in. It will take a while before the entire bullish process is complete.
The top is not only calculated based on time duration but also on price levels and marketwide action. Depending on how the rest of the market is doing; looking at Bitcoin and at what price the pair in question is trading can help us confirm if the top is in. For now you just keep on holding.
Each chart/project/pair needs to be considered individually. If your technical analysis ability is lacking, you can always contact me and I will publish an update for you. If you publish news articles, videos, trade-signals or even TA, you can come to me for confirmation, ideas or just inspiration and I will take care of the rest. Once you have your update you can decide what actions to take. It is still early in this game.
The initial portion of the bull market is long gone. Here it started in November 2024, you can see it as the "market bottom." We are on the second portion now in 2025. The year started with a correction and the correction ended in April-June with a very strong higher low. Projects like this one reveal super-strength compared to the rest of the market, it happens with the top 100.
If you consider some of the smaller projects I've been sharing, you see double-bottoms compared to 2024, 2023 and even 2022 and even new all-time lows. Here the low in 2025 is far away from November 2024 and this is good news. That is why I say that each chart/pair needs to be considered individually because conditions are not the same for each project. The market has now thousands of good projects and tens of thousands of trading pairs. It is impossible to say how one will move based on the other because they are just too many and too far away.
The bigger picture and the general bias, yes, bullish all across. Exact resistance and support levels, where to sell, where to buy; should I continue to hold? This is what needs to be considered individually.
Your support is appreciated.
If you enjoyed, please follow.
Namaste.

HBARUSWe´re in a bigger correction in HBAR and I expect a 5th wave in this correction. Right now we´re in the correction of the 4th wave and completed a ABC pattern.

Buy Trade Strategy for HBAR: Backing Enterprise-Grade DLT AdoptiDescription:
This trading idea is centered on HBAR, the native token of Hedera Hashgraph, a next-generation distributed ledger technology (DLT) designed for speed, security, and scalability. Unlike traditional blockchains, HBAR uses a unique hashgraph consensus mechanism, making it exceptionally efficient and suitable for enterprise adoption. Major companies, including Google, IBM, and Boeing, are part of Hedera's Governing Council, which enhances its credibility and long-term sustainability. HBAR is used to power decentralized applications, pay for network services, and secure the network through staking.
As interest in scalable and environmentally friendly DLTs grows, HBAR is well-positioned to benefit from broader institutional and developer adoption. Nevertheless, the crypto market remains highly volatile and is influenced by a variety of external factors such as regulations, market sentiment, and global economic trends. Investing in HBAR requires a balanced risk management approach.
Disclaimer:
This trading idea is provided for educational purposes only and does not constitute financial advice. Cryptocurrencies, including HBAR, involve substantial risks and may result in the loss of your entire investment. Always conduct independent research, consider your financial situation, and seek professional advice before making any investment decisions. Past performance is not indicative of future results.
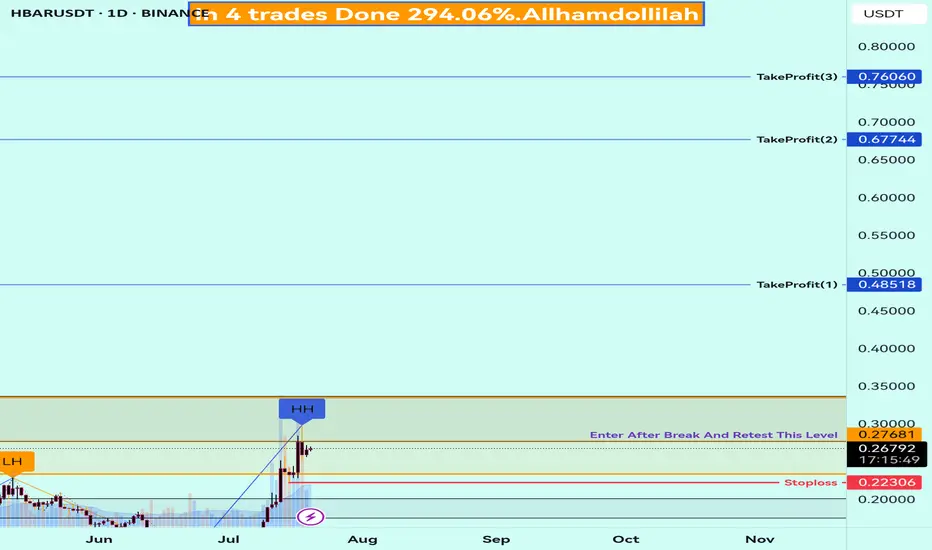
HBAR UP - Bullish Retest for Trend ContinuationThis long trade setup is based on Hedera (HBAR) showing significant strength after a strong bounce from the major long-term support zone around $0.15. The price has successfully broken out above key momentum indicators, including the 9-day SMA and the daily VWAP.
The current price action represents a classic pullback, re-testing these broken levels (currently around $0.245) as new support.
This retest offers a favorable entry point for a long position, anticipating a continuation of the uptrend.
Target: The primary profit target is the next major resistance level, located at approximately $0.347.
Stop-Loss: A stop-loss placed below the recent support structure at $0.197 would invalidate the bullish thesis.
Risk/Reward: This setup provides a favorable risk/reward ratio of approximately 2:1.
HBAR Is About to Melt Faces!I see a powerful reversal coming on HBAR due to a breakout from this falling wedge pattern. A new high above the $0.35 resistance should be coming soon. I’m bullish!
As always, stay profitable.
– Dalin Anderson

HBAR/USDT Long1 Hour chart .This is a possible setup i am watching and looking at for a wile as HBAR has been respecting bull flags. Please share your comments
HBAR Price Drop To $0.20 Likely; $53 Million Liquidation AheadBINANCE:HBARUSDT price currently sits at $0.235, encountering resistance at $0.241. Despite its recent rally, the broader market conditions are pulling it down, and the next major support level is at $0.220 . If the altcoin fails to hold above this level, it could slide towards $0.200.
Looking at the liquidation map, there is a real possibility of significant losses for $BINANCE:HBARUSDTtraders. The map shows that if the price drops to $0.20 or lower, approximately $53 million worth of long positions would be liquidated . This would create a wave of selling pressure and potentially drive the price down further.
In the event of a surge in bearish sentiment or increased selling pressure, BINANCE:HBARUSDT could fall below $0.220 , hitting the psychological support level at $0.200. A drop below this critical level would likely trigger the $53 million worth of liquidations, further exacerbating the decline.
However, if BINANCE:HBARUSDT manages to hold above $0.220 and successfully breaches the $0.241 resistance, there could be an opportunity for a rally. A successful bounce off $0.220 could push HBAR towards $0.267 , providing some relief to traders and reinforcing its bullish outlook.