Riding the Waves of Optimism: Hedera HashgraphRiding the Waves of Optimism: Unveiling the Bullish Trajectory of HBAR
In the world of cryptocurrency, Hedera Hashgraph (HBAR) has been making substantial strides that echo a promising future. The buzz surrounding HBAR's potential ascent to $0.13 in 2023, as suggested by market experts, has invigorated the crypto community with enthusiasm. While predictions are speculative, they stem from a series of favorable indicators and developments that are propelling HBAR towards a bullish trajectory.
1. Strategic Integrations with Web 2.0 Enterprises: Hedera Hashgraph's progressive collaborations with prominent Web 2.0 enterprises have been a pivotal driving force behind its upward momentum. The platform's ability to seamlessly integrate blockchain technology into existing business models has garnered significant attention. As more enterprises recognize the benefits of harnessing the capabilities of Hedera's ecosystem, its adoption is poised to skyrocket.
2. Resilience Against Market Volatility: HBAR's performance during market fluctuations has demonstrated its resilience and stability. While short-term market shifts may lead to temporary price corrections, HBAR's consistent rebound after such episodes suggests a strong underlying demand. This phenomenon can be attributed to its growing utility and use cases, which extend beyond mere speculation.
3. Nurturing Long-Term Growth: Despite short-term bearish sentiment, the overarching sentiment surrounding HBAR remains optimistic. This is underscored by the anticipation of HBAR reaching $0.078 by 2024, as market observers believe that the platform's ongoing partnerships and technological advancements will catalyze sustained growth.
4. Building on Past Achievements: HBAR's historical price performance, including its previous all-time high of $0.56 in September 2021, showcases the token's potential to surge to new heights. This historical context provides a valuable perspective on HBAR's capacity to regain and surpass its previous peaks.
It's essential to recognize that the cryptocurrency market is inherently volatile, and predictions are speculative by nature. While the factors mentioned above indicate a bullish sentiment surrounding HBAR, investors should conduct thorough research and exercise caution before making investment decisions.
Disclaimer:
The information provided above is for informational purposes only and does not constitute financial advice or a recommendation to invest. Cryptocurrency investments involve substantial risk, including the risk of loss of capital. The price of HBAR and other cryptocurrencies can be highly volatile and may fluctuate significantly. Readers are advised to conduct their research and consult with financial professionals before making any investment decisions. The author and publisher of this article shall not be held responsible for any investment decisions or actions based on the information provided herein.
HBARUSDT trade ideas

Hbar 4H SMC counter trade ideaBINANCE:HBARUSDT.P www.tradingview.com
This is counter trade excute with caution!
Wait for at least 5min confirmations
Your comment and ideas are welcomed.
Cheers!

HBAR/USDT Confirms its Bullish Move, Hedera Hashgraph Analysis Hello Paradisers, Time to get into action!!
💎 HBARUSDT is gearing up for a potential rise and anchored above the 21 EMA, signaling bullish vibes.
💎 Underpinning this optimistic view is the Demand Zone lying just below, which will definitely boost the bullish drive.
💎 Beyond this zone, we've spotted a bullish nod on a smaller timeframe, hinting that the price might circle back to this level.
💎 On the flip side, if the price drifts into the invalidation zone and slips through, we might witness a bearish turn.
💎 Stay connected for more updates and savor your trading journey with #MyCryptoParadise!

HBAR Not looking good.Pullback IncominHBAR could not retest the premium area and got rejected heavily. lets see if it can hold the inner bullish trendline.
Thanks for watching


HBAR Grabbing Buyside Liquidity and finding its HTF Range Top TP Profits clearly laid out corresponding to Premium PD arrays. I don't believe its going to a big bull run. Reversal Level to look out for would be at TP2. If it does take liquidity level at 0.09 cents and consolidates for more than a week or moves strongly past, Hbar to the moon.
Likely ranging on the weekly.

HBAR/USDT Analysis: Massive 800% Gains Expected!HBAR/USDT Technical Analysis: Potential 800% Gains Expected in Next Bull Run
Introduction:
In this technical analysis, we will be examining the current state of HBAR/USDT, a popular cryptocurrency pair, and exploring potential entry points and price targets for long-term holders. Please note that this analysis is solely for informational purposes and not financial advice. Always conduct your own research before making any investment decisions.
Current Market Overview:
As of the latest data, CRYPTOCAP:HBAR is trading at $0.0519. The overall market trend for altcoins is not bullish at the moment, suggesting the possibility of further corrections in HBAR/USDT.
Entry Levels for Long-Term Holders:
For long-term holders, the green box represents the best entry zone. Consider initiating positions at the following levels:
Entry 1: $0.037
Entry 2: $0.028
It's important to be prepared to buy within this zone, as it may present an excellent opportunity for substantial profits.
Price Targets and Resistance Levels:
Once the entry points are hit, it's essential to plan potential exit strategies based on resistance levels. The following price targets are observed on the chart:
Resistance 1: $0.083
Resistance 2: $0.17
Resistance 3: $0.25
Expectations for Next Bull Run :
With the current analysis and the potential for a bullish trend, it is reasonable to anticipate a significant increase in value during the next bull run. An estimated 800% growth from the entry zone is projected.
Support Levels:
In case of any downturns, the following support levels can be considered:
Support 1: $0.037
Support 2: $0.028

🔥 HBAR Bounce Signal With Great Risk Reward Potential!HBAR has been holding up reasonably well compared to many other alts. For that reason, I'm more confident to look for a bullish reversal pattern to play out.
My entry will be around the bottom support, stop just below 0.05, target at the top resistance of the rising wedge pattern.

Navigating Resistance and Support Amidst Positive MomentumHBAR has recently surged to the $0.060 range, but encountered a formidable obstacle as this level acted as a crucial resistance and a strong supply area. As a result, many buyers seized the opportunity to take profits within this range, and this limited the formation of additional demand for further price growth. Nevertheless, there seems to be a supportive zone around $0.050 on the chart, which elicited a positive reaction and still indicates a bullish outlook for the medium-term conditions of this currency.
Unless a strong bearish candle appears under the $0.050 range in the daily timeframe, it's reasonable to expect the price to continue trading within the established range channel. Additionally, if we shift our perspective, we can observe an ascending channel on the chart. As long as the lower boundary of this channel remains unbroken, we can anticipate positive fluctuations in the currency's price, potentially leading it towards the $0.060 range.
Moreover, it's worth noting that the RSI level currently stands at 51. This means there's a moderate level of buying and selling pressure, signifying a relatively balanced market sentiment
HBAR current patternNot the financial advise, but there is a pattern why You should go long for HBAR. Cheers.

HBAR and the potential opportunity Hi Everyone;
today we have one of the best risk to reward Investment opportunity
it is almost 400 time the risk and the chart is look very promising.
I expect breaking the previous bear market key point will clear the way to the final target.
good luck everyone.

Keep an eye on #HBAR/USDT Diagonal Trendline in Daily TF!CRYPTOCAP:HBAR needs to bounce from here to gain bullish momentum, Breakdown below this trendline is bearish.

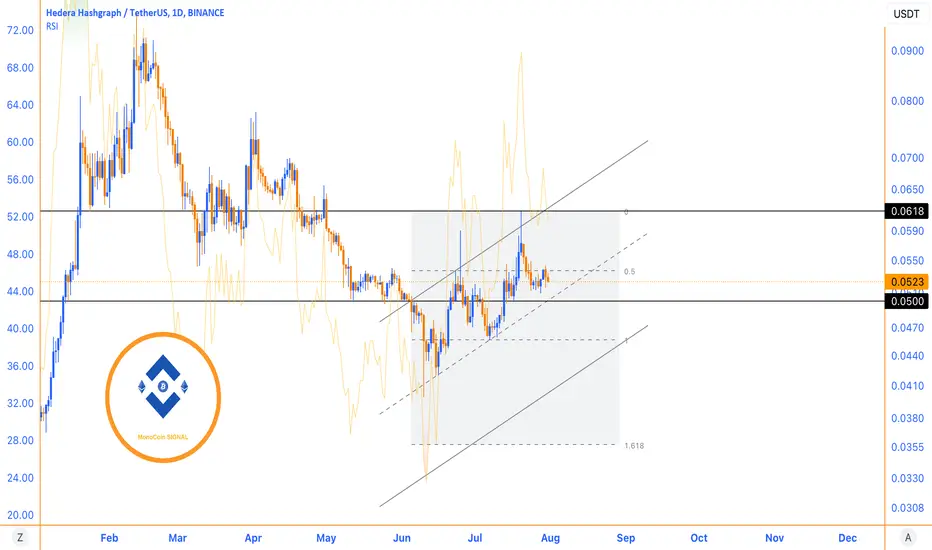
HBAR Possible Playout ChartThe price change of HBAR or Hedera is predicted to strengthen in the near future. Currently, its support area is at $0.0531, which serves as a retest of support since HBAR previously attempted to test the resistance at this price in June and successfully broke out in July as confirmation. The target for HBAR's price increase is at the $0.0592 level, which means there is a potential gain of 11.32%. To confirm a failed price increase, HBAR needs to break and close below the $0.05 area, which is both a psychological price level and its support area. #dyor (Do Your Own Research).

HBAR (Hedera Hashgraph) Coin Analysis 05/04/2021we had earlier analyzed and Purchased and Opened positions on this Coin:
Fundamentals:
Billed as the "trust layer of the internet," Hedera Hashgraph is a public network that allows individuals and businesses to create powerful decentralized applications (DApps).
It is designed to be a fairer, more efficient system that eliminates some of the limitations that older blockchain-based platforms face — such as slow performance and instability.
It was funded through an initial coin offering (ICO) in August 2018 and first launched open access to its mainnet just over a year later in September 2019. As part of the ICO, investors were able to purchase the platform’s native utility token (HBAR) at the lowest possible pricing.
The HBAR token has a dual role within the Hedera public network.
First and foremost, HBAR the fuel that powers Hedera services, such as smart contracts, file storage and regular transactions. Second, it's used to help secure the network, since HBAR users can stake their tokens to assist with maintaining the integrity of the platform.
Unlike most other cryptocurrency platforms, Hedera Hashgraph isn’t built on top of a conventional blockchain. Instead, it introduces a completely novel type of distributed ledger technology known as a Hashgraph.
This technology allows it to improve upon many blockchain-based alternatives in several key areas, including speed, cost, and scalability. Hedera transactions have an average transaction fee of just $0.0001 USD and typically reach finality in under five seconds. Overall, Hedera Hashgraph claims it can handle more than 10,000 transactions per second (TPS) — compared to the around 5-20 for most popular proof-of-work (PoW)-based blockchains.
The platform offers several major network services. These include:
A token service that allows users to easily configure and mint both fungible and non-fungible tokens (NFTs) on Hedera with just a few lines of code.
A consensus service that acts as a layer of trust for any application or network that needs a secure, verifiable log of events.
Smart contract tools that let developers build powerful and efficient decentralized applications.
Decentralized file storage services with features include proof-of-deletion, controlled mutability, and time-based file expiry.
Hedera Hashgraph uses a novel consensus system known as Hashgraph consensus to keep its network secure.
This uses a rotating governing council consisting of up to 39 highly diversified organizations that span across up to 11 different industries. These are involved with directing the Hedera codebase, voting on platform decisions and operating the initial nodes on the Hedera public network.
Hedera uses a novel form of proof-of-stake (PoS) which allows HBAR users to stake their resources to help protect the network. Right now, all Hedera nodes are managed by either Hedera itself or the governing council members, but there are plans to switch to a permissionless system in the future.
\ Overall, Hedera's security setup ensures it achieves "asynchronous” Byzantine fault tolerance (ABFT) — meaning it can guarantee both the timing and order of a set of transactions, even if some data is delayed or lost.
Hedera Hashgraph has two founders: Dr. Leemon Baird and Mance Harmon.
Dr. Leemon Baird is credited as the investor of the hashgraph distributed consensus algorithm and currently works as Hedera's chief scientist.
Prior to founding Hedera Hashgraph, Baird accumulated more than a decade of experience in various computer science and security roles and previously worked as a senior research scientist at the Academy Center by Cyberspace Research. He also holds the position of co-founder and CTO at Swirlds Inc., a platform for building DApps.
On the other hand, Mance Harmon is Hedera’s CEO and an experienced technology executive and seasoned entrepreneur. Harmon has around two decades of experience holding executive roles at prominent firms — many of which are in the IT security industry. Like Dr. Leemon Baird, Mance Harmon also holds a second position at Swirlds Inc., as its co-founder and CEO.
In addition to the founders, the Hedera leadership team also comprises more than a dozen individuals, many of which have had distinguished careers.
The Hedera Hashgraph token, HBAR, has a maximum total supply of 50 billion units. Out of this, almost seven billion were in circulation as of January 2021 — equivalent to around 14% of the total supply.
Hedera publishes regular reports detailing when the next wave of HBAR tokens will be unlocked. These reports can be viewed here.
According to Hedera's resources, the two project founders each have a coin grant of two billion HBARs, equivalent to 4% of the total supply each. These tokens are vested over a six-year period.
Other senior executives at Hedera (that joined prior to 2018) have coin grants of between 250 million and 300 million coins. These tokens are vested over a period that ends in December 2021.
According to Hedera's Economics Whitepaper (published June 2020), around 17.03 billion HBAR is estimated to be in circulation by 2025 — equivalent to 34% of the total supply.
The live Hedera Hashgraph price today is $0.328376 USD with a 24-hour trading volume of $238,828,303 USD. Hedera Hashgraph is up 0.07% in the last 24 hours. The current CoinMarketCap ranking is #46, with a live market cap of $2,599,706,500 USD. It has a circulating supply of 7,916,866,045 HBAR coins and a max. supply of 50,000,000,000 HBAR coins.
The top exchanges for trading in Hedera Hashgraph are currently Binance, Huobi Global, Upbit, OKEx, and FTX.
Technical Analysis:
as you can see the MACD and Signal Line are showing some Tilt down and crossover, which is the sign of some price correcting though there exist a Mild Bearish Divergence.
by Fibonacci retracement we have defined some retracements levels which are the golden zone and a powerful Support area, which can show some good Support and price may bounce from them to the higher levels
we have defined 3 Targets using Fibonacci Projections of the Past Impulsive wave and presumed Maximum retracement and price correction of 61.8% Fibonacci retracements.
the 3 TP gets its confirmation as the price triggers the 2 TP followed by some price correction and reaccumulation
we are asumung the 3 TP to gets trigried less than and within 8 months time'
the dotted arrows are just to show the bias and process not an actual indication of price forecast

HBAR buy setup as long as btc remains in a range of 30-31k ALTS have a chance to take some move hbar moving in a falling wedge and is heading towards the resistance area here is my buy setup with a low risk high reward please make sure that you manage your risk properly according to the trade

HBAR BREAKOUT UPDATEHBAR Falling Wedge Breakout on Daily Timeframe
showing 2x spots potential for long term

HBARUSDT 3D#HBAR broke the Falling wedge and now is testing the resistance cluster(MA50 + MA100 + 0.236 Fibo). In case of breakout huge pump is coming. Let's see what will happen next :)

HBARUSDT Long/ShortAfter a Long Struggle, HBAR tried to breakout will acceptable Volume,
expected upward trend as per described at chart
This is just a view, DYOR and NAFA
ThankYou

HBAR BullishAs its obvious HBAR broken a long downtrend and created and invers head & shoulders pattern.
Supports and resistance is clear in the chart. Right now can be a good entry (0.049$ - 0.0515$).
Midterm targets cant be 0.07$ and 0.09$.

Hbar Building For Breakout Finally Hbar Building Up For Massive Breakout Formed Falling Wedge In 3 days tf Incase Of Successful Breakout Expecting 250%+ bullish Rally

#HBARUSDT #LQR #TOBTC #LaqiraProtocolThe price is below the daily resistance and we have dynamic support on the chart. If break, consolidation and matching with Bitcoin levels you can open positions from any direction. This analysis is not an offer to buy or sell

Hedera LONGChart in accumulation phase but creating some very bullish indicators now that a mark up could be close. Massive accumulation at the lows, breaking out on the weekly, indicators turning up

HBARUSDT shortBINANCE:HBARUSDT
BYBIT:BTCUSDT
MEXC:BTCUSDT
BINANCE:BTCUSDT
HBAR short from the last order block
1:12 Risk to reward
entry area: 0.04851 - 0.04834
SL: 0.04851
TP: 0.04630
