HederaCryptocurrency Hedera has shown tremendous growth during the rally earlier this year. And even when Bitcoin did its correction, this cryptocurrency was at its peak. Now, during the next exit of Bitcoin to the maximum, Hedera, on the contrary, accumulates the price near the support level. Also, now the price is under the trend resistance level and is preparing to make a breakdown. After which, most likely, we will see high volatility on growth in the short term.
HBARUSDT trade ideas
$HBAR looks ready to rise$HBAR is getting strong reaction from 0.840 levels. MACD is about to give a buy signal in 4H. I am waiting for an uptrend with the RSI crossing the 50 level in 4H. My TP target is 0.1040

Keep Your Eyes on HBAR#HBAR appears to be heading towards a retest of its trendline in the next hour on the 1-hour timeframe, which could result in a potential bounce if everything goes as expected. However, it's important to keep an eye on the trendline as a break below it could signal a bearish trend.

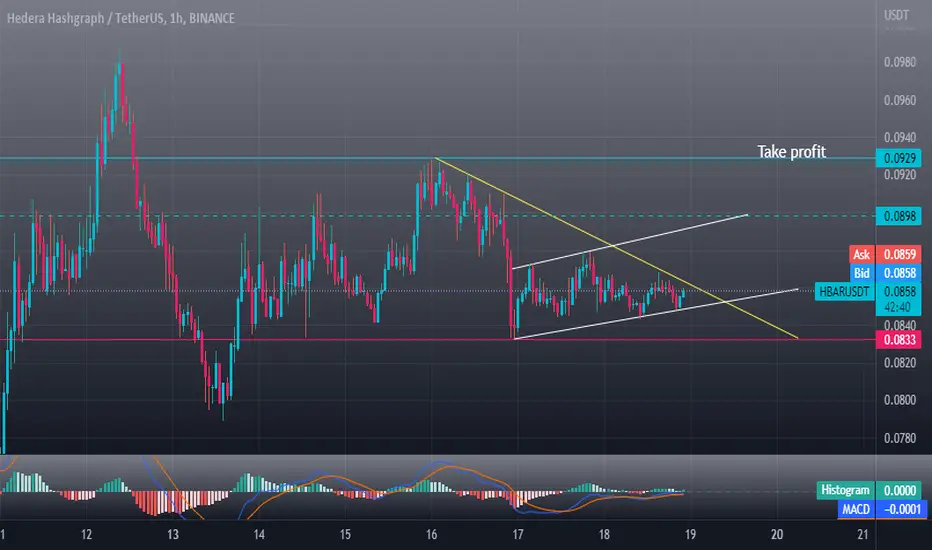
A break of static resistance is not yet confirmedWe saw that the resistance of the $0.080 to $0.085 range was broken. Importantly, resistance has been placed above this level in the $0.10 range, temporarily blocking HBAR price from further growth.
Therefore, the strong negative reaction that has been observed in the past few days can cause the price to enter the range trend this week.
The resistance support levels drawn on the chart can be considered reactive and important ranges, which can be used for short-term trades in case of the formation of return patterns in the low times.
Also, as long as the bottom of the channel is not broken, there is a potential for the trend to remain bullish in the 4-hour timeframe. A break of static resistance is not yet confirmed and requires daily candles to stabilize above this level.

HBAR taking out ShortsA retest of Preliminary Supply may well be in order next; an ABC correction to fill whale shorts.
HBAR has also been heavily shorted, so shorts need to be cleared before the drop.

HBARUSDT IDEAHBARUSD HBARUSDT
✅ ✅ Risk warning, disclaimer: the above is a personal market judgment and analysis based on published information and historical chart data on The trading view,
And only some of these analyzes are my actual real trades.
I hope Traders consider I am Not responsible for your trades and investment decision.

HBAR 200%+ if we we hold .028c .104 is target within 90 daysNot financial advice.
Trade idea moving forward.
Try to make your buys as close to .028 as possible but DCA your buys
Staying over .028 we have a target of .104 moving forward for next 90 days.
So we have a good consolidation range here to still feel comfortable DCA into your buys
The trendline you see on the STOCH RSI is derived from the the monthly charts and currently we broke out of the monthly trend line for RsI and it's flat and ready for a move.
These targets come from a 3 month charts where .028 is lowest we should hypothetically go and as high as .13c but .10c is realistic.
#PIK
Patience is Key
#TLAW
Think Like A Whale

Bullish HBARNot much to write. All crypto is finishing impulses up which started month ago. After correction is is going to be another one. But do not think it is going for new ATH.

HBARUSDTHi friends
I think we have reached an important demand area and there is potential for further growth.

HBAREven though I was watching it for a while, I missed the break our,
Anyway you guys should take profit at 0.096
Good luck

HbarusdtFormed Massive wedge In daily Timeframe Incase Of Breakout expecting 150 to 170% bulish Move
Keep In Mind Entry Would Be Only valid After Breakout Without Breakout Hbarcoin will Remain Bearish
Safe Sl Area Would Be Below Wedge

HBAR How we caught the easy 60% Move 🔥💸When everyone is getting bearish most altcoins were hitting the weekly demand zone,One of the most lucrative coins for our team to look at was the HBAR coin which it hit the weekly demand zone. So we entered positions both in spot and future"s and we are currently up by 60%.
There are many more coins that have hit the weekly demand zone and have run higher from the bottom.
Message us if you have any queries and follow for more charts updates.
The old hbar idea is linked below.

Hbar On Route Of Massive Recovery Major Trendline Has already Broken
Testing Horizontal Resistance
Moving Averages 50Ma & 200Ma Crossover About To Happen
Once Daily Candle Closed Above Horizontal Resistance Next Possible Target Would Be Between 0.16 to 0.20

Low risk buy HBARI am attempting a cheeky buy on HBAR here. Top of the range but looks like it could be getting ready to make a huge break out soon. Or a break down. Proper risk management would be advisable.

HBARUSD LongBuy and Hold Hedera Hashgraph ... Current price is $0.870 , Today we have strong bullish signal on daily chart, Target is $0.30 level, potential profit +250%...

hbar can too moon in short termHi
hbar can to reach higher resistance base of fibo in short term.
tp1 : 0.089
tp2 : 0.099
tp3 : 0.11
tp4 : 0.13

Finally Breaking Another Bulish Pattern Forming Bulish Pennant In h4 Timeframe
Incase Of Breakout Expecting 25 to 30% bulish move Keep Eyes On for Breakout

Bullish signs!!Getting back above the 55 ema on the 4hr at .0832 and holding will be a great start. If the bullish flag pattern completes, we could make a push to get back above the gaussian channel on the 5 day. That would also put us testing or getting above the 200 ema on the 5 day. This would be super bullish for HBAR! If we were to fail any back test of the flag then that could push us back into the flag zone.

✴️ Hedera Hashgraph | 260% Potential (Name Your Altcoin #26 ✅) The altcoins market continues to heat up and we move to HBARUSDT (Hedera Hashgraph) next at the request of one of our followers.
This altcoin pair went bullish by mid-January and has been consolidating for the past two weeks, with high volume and a strong RSI.
This is telling us that the bulls are in full control of the chart, since these signals are available while HBARUSDT trades above EMA21 and EMA10.
The next target is set at 61% at $0.11111 followed by 261% at $0.25868.
These targets can be hit in the short to mid-term (1-3 months).
Namaste.

Corrective Fibonacci resistance levelIn the weekly timeframe, the resistance of the $0.077 range is considered as the corrective Fibonacci resistance level, which due to the negative reaction to this level, we expect to finally see a strong negative reaction from the $0.925 range resistance in the future.


HBARUSDT | RANGE IN PLAYHBAR has been trading with in the range since 2 weeks.
The price has made multiple time to break on either side but get rejected.
Once the price breaks above the range bulls will get complete control
Trade your levels accordingly

I am looking for help 1 min 5 Min level super short term strategLooking for mentor for 1 min 3 or 5 mins day trading trading idea and system.
