HBARUSD: Daily VCPVCP: 2W 24/3 3T
The posted chart contains a VCP (volatility contraction pattern). The first label "W" stands for weekly and shows the duration of the entire consolidation. In the middle label, the percentage of contractions is indicated (for example, "15/4"), with 15 representing the -15% depth of the base and 4 representing -4% of the last contraction. The last part "T" represents the number of contractions. The light blue lines in the chart correspond to the contractions. A more detailed description can be found in Mark Minervini's books.
RS stands for relative strength and measures the strength of the stock compared to the overall market. The value range is 1-99 with 99 being the highest value. The rank was generated by fyntrade.
HBARUSDT trade ideas


Has not been able to cross this resistance yetHBAR had a range trend last week. Its price, which had hit the resistance of 0.070 to 0.073 dollars, has not been able to cross this resistance yet. Because the resistance of the roof of the main descending channel is also in this range. Therefore, the strong upward trend has been ranged by reducing demand and saving profits of some short-term buyers. Support in the $0.0583 range is evident on the chart, and the short-term trend is more likely to continue between these two levels.

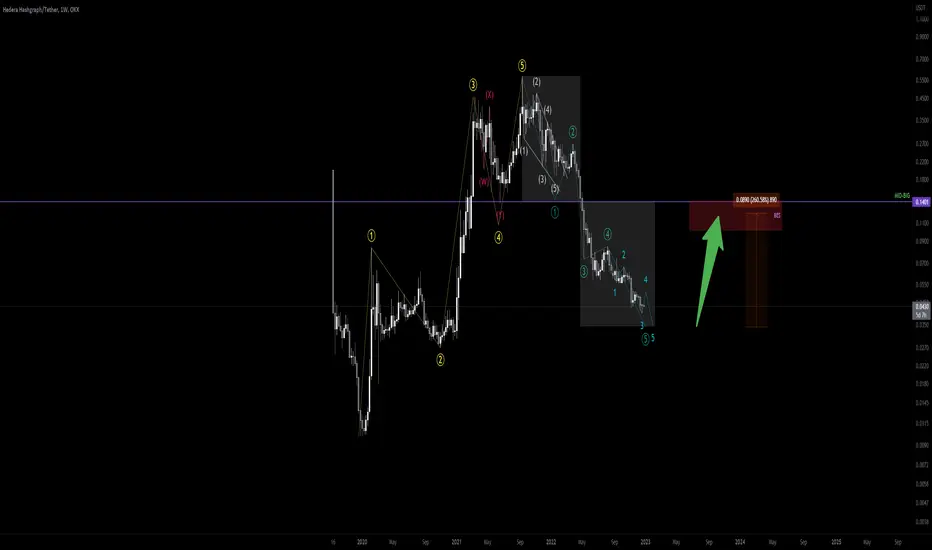
$HBAR 600% from ATH - but low momentum?Currently has not broken out of the 2022 downtrend
Is above key S/R level
Seems to have low momentum as compared to other tokens.

HBAR Signal Jan 2023: Layer1/Layer2/Layer0 Portfolio ReviewPosting this up to see where it is in the future. . .
I know its not technically an L1,L2,L0 but it does have its own ecosystem so.. yeah

$HBAR - where does this dip? What a beautiful chart. Can easily see red getting tagged.
Where do you think this dips to?

🔥 HBAR Making A Higher Low: Pump Coming?Last week I made an analysis on HBAR and the bullish break out that occurred from the falling wedge pattern. My target of $0.08 has been hit, congratulations if you took the trade.
In my view, it's likely that HBAR will make a higher low in the coming days. I'm looking at the yellow area for a potential bounce from support.
Bitcoin is likely to continue to go up for the foreseeable future, so alts will likely follow suit.
Blue lines are my targets.

Bullish wave can resumeHBAR continued its upward trend last week, and a sharp break into the $0.070 - $0.073 resistance range has been seen. The daily candle has not yet closed above this level, and the breaks that have been recorded are fake. In the 4-hour timeframe, the price of HBAR is inside a narrow ascending channel, the ceiling of this channel was fake broken in the past days, and due to encountering a strong resistance, this reaction has caused the price to return to the channel. So, according to this reaction, there is a possibility that the price trend will be below this range for some time. But further, because the potential for a trend change has been created in the daily timeframe, and the bullish wave can resume by correcting to the support range of $0.0605 - $0.0550, we expect the current resistance to be broken for the next week.

HBAR/USD - Looking for an Entry if Support fails.Limited Support at current price- Anticipating Dip
Might be worth considering if support is lost and entry at the original break price becomes an option 0.0470USD
Preferred Entry 0.0375USD
If entering at current- Consider tight stop loss and target 20% (but personally it's a no for me)
As Always,
Just my thoughts and TA
Feedback welcomed.
Bingaz.

HBARUSDT 20% MOVE EXPECTEDAnother push up is expected. Bullish divergences and breakout of bull flag. With this 20% move likely to be forming a Head & Shoulder pattern, with a 30 % correction back to ca. 0.058 area.
This is not financial advice. DYOR & GL

HBAR/ USDT Idea✅ ✅ Risk warning, disclaimer: the above is a personal market judgment and analysis based on published information and historical chart data on The trading view,
And only some of these analyzes are my actual real trades.
I hope Traders consider I am Not responsible for your trades and investment decision.

🔥 HBAR Massive Falling Wedge Break OutOver the last couple of weeks, HBAR has seen a great bullish move from the lows around $0,036. During Bitcoin's latest bullish move, HBAR and many other cryptos have seemingly broken their long-term downtrends, which is great news for bulls. HBAR stands out today in particular since it seems to be the leading market bull.
I'm looking at $0,08 as a strong resistance in the near future. If you're long, consider taking some profits around that area.

HBARUSDT Short ideaHBARUSDT Short idea on Bybit. These are major levels, but of course it will depend a bit on what move bitcoin will take.

We expect to see the range trend of this HBARThe first support is at the price of $0.050, which was the first encounter with a positive reaction, and the second support is considered in the $0.044-0.046. With this strong reversal, we expect to see the range trend of this HBAR between the specified levels this week. After that, we can expect higher targets in the $0.070 range to be available to buyers after the upcoming resistance is broken.

HBARUSDT | BEARISH CHANNELHEDERA HASHGRAPH has been trading in bearish parallel channel .
The price is printing lower lows and lower highs
The price is currently trading at upper boundary of channel.
There is a confluence point having horizontal resistance and 100MA too.
It is trading at an important zone.
The bears will get control in this zone.
Manage your levels accordingly.

HBAR | Will History Repeat itself?#HBAR Pretty Solid Downtrend Breakout ✅
Will History Repeat itself ?
Please like the idea for Support & Subscribe for More ideas like this and share your ideas and charts in Comments Section..!!
Thanks for Your Love & Support..!!

HBARUSDT LONGHBARUSDT LOOKS STRONG AND GOING TOWARDS .04080 level
We will this level in next 4 hour candle.

RR=1.62 Buy ideabullish butterfly pattern + RSI divergence
PS : never risk more than 2% of your capital per trade

HBARUSDTPERP HBAR Analysis includes Support lvls and Resistance ..
Further , HL analysis
Entry Lvl :0.03821
TP : 0.03896
SL : 0.03753

HBAR - Ending diagonal 5th wave.My previous analysis of this coin dates back 6 months.
I got it wrong in that 70% odd should have been in favor of the correction not being done. In hindsight, there was no divergence on the weekly (there still isn't). But is that the relevant timeframe? Probably not, also in hindsight. Now, having zoomed in slightly to the 3D chart (still Log), we can see there is a nice divergence on many indicators (I've only marked RSI for clarity):
RSI
MTF
Histo
Volume
Rate of Change
Is now the right time to say that we have 70% odds of the correction is over? I won't make that mistake again :D But its looking good. I'll be waiting with an alert set on my FSS Indicator to print a buy signal on this 3D timeframe to add to my bags.
Happy and safe trades to you all.
For reference, this is the link to the former Idea is below under related ideas.

HBARUSDT ABCD The ABCD is a basic harmonic pattern. All other patterns derive from it. The pattern consists of 3 price swings. The lines AB and CD are called “legs”, while the line BC is referred to as a correction or a retracement. AB and CD tend to have approximately the same size.
A bullish ABCD pattern follows a downtrend and means that a reversal to the upside is likely. A bearish ABCD pattern is formed after an uptrend and signals a potential bearish reversal at a certain level. The rules for trading bullish and bearish ABCD patterns are the same, you will just need to take into account the direction of the pattern you trade and the movement of the market it predicts.
Likes and comments if you have questions! 🍌
Thanks!

HBAR CAN FALL AGAINHi, dear traders. how are you ? Today we have a viewpoint to SELL/SHORT the HBAR symbol.
For risk management, please don't forget stop loss and capital management
When we reach the first target, save some profit and then change the stop to entry
Comment if you have any questions
Thank You
