HBARHBAR
March 26, 2025
7:35 AM
From a tech perspective, looks like we’re heading into the final leg ( W5 ) targeting around $0.7795, if we’re measuring it through W3 + W4. Also spotting some bullish divergence showing up on the HTF, which adds to the bias.
A couple of solid confluences here too: on the D1 TF, HBAR just bounced off the 200 MA, which is a pretty key support, and it’s also sitting right inside a daily OB. Looks like buyers are stepping in.
Q: So is it good for buying on spot?
Yeah, HBAR is a solid crypto project. I actually shared my thesis on it — you can check it out on my channel, just scroll up a bit.
Q: Is it good to long on futures?
That really depends on your style. If you're a swing trader, then maybe — but personally, I don't think HBAR is ideal for swing longs or even day trades right now. The price action on LTF is pretty choppy, and it’s not the kind of setup that suits everyone. We all have different risk tolerance levels, so make sure it aligns with yours.
HBARUSDT trade ideas

HBAR next impulse down The overall chart leans bearish with no signs of a reversal yet.
Momentum analysis indicates that HBAR is likely to continue its downtrend.
TP 0.11584
SL 0.19912

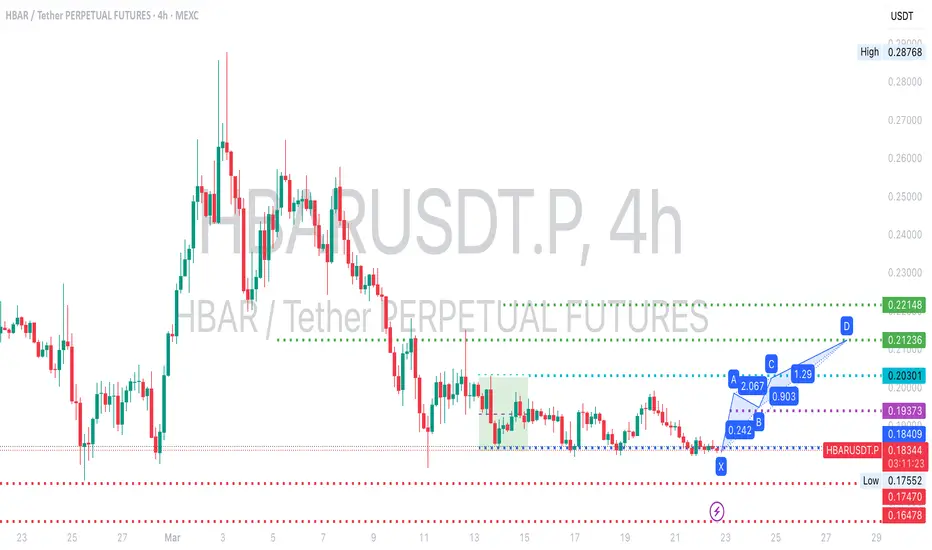
Trading Idea (HBAR/USDT, 1H Chart, 23rd of MarchChart Analysis:
➤ 1) The price is still struggling below the major EMAs (20/50/100/200), indicating bearish pressure.
➤ 2) RSI is mumbling around the midline, showing a slight bullish pull but lacking strong momentum.
➤ 3) The recent small upward move hasn't broken the trend, and the EMAs are still positioned in a bearish sequence.
➤ 4) Volume remains relatively low, suggesting that buyers are not stepping in aggressively yet.
🐻 Bearish Scenario (Fakeout):
Probability: 60%:
If the price pushes above the EMA 50 (around 0.185) and gets rejected at EMA 100 or 200, we might see a sharp pullback.
💡 Entry for short: 0.187 - 0.189
✂️ Stop Loss: 0.192
🏁 Take Profit:
➣ 0.180 - TP 1
➣ 0.175 - TP 2
🐂 Bullish Scenario (Reversal):
Probability: 40%
If the price consolidates above the EMA 200 (around 0.190) with volume increasing, it could indicate a trend reversal.
💡 Entry for long: 0.192 - 0.194
✂️ Stop Loss: 0.188
🏁 Take Profit:
➣ 0.200 - TP 1
➣ 0.210 - TP 2
🚨 Stay awake, this setup is valid for the next 12 hrs. or until NY session. This is not a trading advice.

HBARUSDT Bull FlagHBARUSDT is currently forming a promising bull flag pattern on the daily chart.
Bullish Scenario:
If you're not in the trade yet, you can consider entering now for a potential long-term position, or wait for a confirmed breakout followed by a retest for added confirmation.
Bearish Scenario:
If the price breaks down from the bull flag, the next major support lies around the 800 SMA on the 8H, 12H, and daily timeframes.
!!! REMINDER !!!
Always pay attention to the signals when you're in a profitable trade. Secure your gains and consider re-entering on the next pullback.
Be Patient - Don't Panic - Trade Emotionless

HBAR ANALYSIS📊 #HBAR Analysis
✅There is a formation of Descending triangle pattern on weekly chart. Also #HBAR is trading around its low level. If the price sustains here and give a bullish move then we could expect a bullish move otherwise we would see more dip.
👀Current Price: $0.18230
⚡️What to do ?
👀Keep an eye on #HBAR price action and volume. We can trade according to the chart and make some profits⚡️⚡️
#HBAR #Cryptocurrency #TechnicalAnalysis #DYOR

Lingrid | HBARUSDT consolidation Before the ExtensionBINANCE:HBARUSDT price is currently consolidating below the psychological level at 0.2000. On the daily timeframe, it's evident that the price continues to test the support zone around 0.1700, indicating a potential breakdown of that zone and further downward movement. Additionally, the formation of an ABC corrective move suggests that the C wave may complete around the 0.1000 support level. As a result, I anticipate the market will break below this support and continue moving lower. My goal is support zone around 0.1600
Traders, If you liked this educational post🎓, give it a boost 🚀 and drop a comment 📣

HBARUSDTHBAR going long with a strategy of shark( 3 insiders bar) on the daily means we can't break the line 0.17276 and we are going on uptrend and no more downside
0.15$ Is a Next Support Area 📉 The Price Is About To Breakdown The 0.184$ Support Toward a 0.15$ Area
👉 The Zone of 0.15$ Is an Interesting Point For Buy HBAR, Will Update This Post After Reaches That Area

HBAR AnalysisSummary:
HBAR (Hedera Hashgraph) is the native cryptocurrency of the Hedera network, utilizing Hashgraph technology instead of a traditional blockchain. It is known for its high speed, low transaction fees, strong security, and energy efficiency. HBAR is widely used for smart contracts, fast payments, and enterprise-level decentralized applications (dApps).
Technical Analysis:
HBAR has shown strong resistance during recent market downturns and is currently in a consolidation phase. It has formed a well-structured setup suitable for both long and short trades.
The price is currently forming a Descending Triangle, maintaining a flat support level while making lower highs.
• After breaking the trigger level, it could move up toward the triangle’s resistance.
• There is a possibility of a trading range forming, but if the price confirms a breakout above the triangle, a bullish move may begin.
• If the price loses support and breaks downward, we could see a continuation of the bearish wave.
This setup provides clear trading opportunities depending on the direction of the breakout.

Swing Trading Plan for HBARUSD (Spot/Low Lev)Key Price Levels
The chart is annotated with color-coded horizontal zones for clarity, marking the entry, take-profit, and stop-loss levels:
Entry / DCA Range:
Price: 0.15036 to 0.17172
Color: Pink
Description: This is the primary zone to initiate a long position. You can enter at 0.15036 and scale in (using Dollar-Cost Averaging) if the price dips higher within this range, up to 0.17172.
Take-Profit Levels:
TP1:
Price: 0.22000 to 0.24000
Color: Light Green
Description: The first profit-taking zone, ideal for securing initial gains after an upward move from the entry.
TP2:
Price: 0.26000 to 0.28000
Color: Light Cyan
Description: The second target, representing a higher resistance area for partial profit-taking.
TP3:
Price: 0.32000 to 0.34000
Color: Light Yellow
Description: The final target, aligning with historical resistance and the maximum expected upside for this trade.
Stop-Loss:
Price: Below 0.11727 (range extends to 0.11500)
Color: Red
Description: This is the hard stop-loss level. A daily candle closing below 0.11727 signals an exit, with the range down to 0.11500 acting as a critical support zone.
Trading Strategy
Entry: Enter a long position within the 0.15036 to 0.17172 range. Consider adding to your position if the price moves toward the upper end of this zone to average your entry cost.
Take-Profit:
Take partial profits at TP1 (0.22000–0.24000).
Secure additional profits at TP2 (0.26000–0.28000).
Exit fully or take final profits at TP3 (0.32000–0.34000).
Stop-Loss: Place a hard stop-loss below 0.11727. Confirm the exit only if the daily candle closes below this level to avoid premature stop-outs from intraday volatility.
Trade Duration: This swing trade is expected to unfold over several weeks to months, depending on how quickly the price reaches the TP3 range.

HBAR LONGwe can see range on daily chart. We are now on the lower band where we can look for long setups. Little specaultive trade can be seen on chart.
What give the confidence in this trade?
if you look OBV is incresing specialy from prevous low the OBV value is much higher!
Tha means we have strong buying presure.
Have a nice day and Be safe ;)

$HBAR about to exploudhbar massive pump here 🔥
waiting for breakout here!
giga bullish🔥
Goodluck !
Dyor!

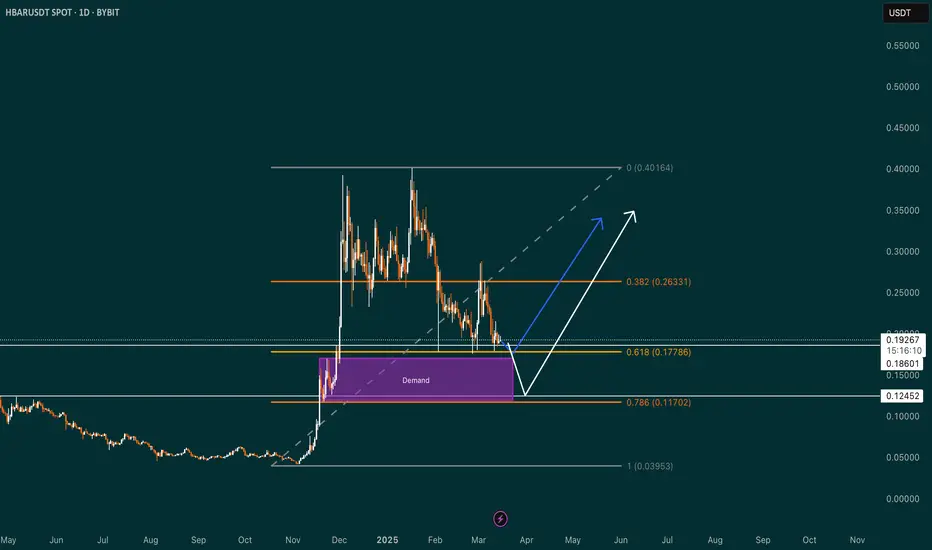
HBAR Update: Golden Pocket & Demand Zone WatchHey traders! 👋
Let’s dive into HBAR (Hedera), one of the most exciting projects right now. 🇺🇸 With the massive potential of this American-based company, combined with the growing buzz around the possibility of Trump’s presidency and the recent ETF approval, HBAR is definitely a coin to keep on your radar. 🚀
1️⃣ Impressive Price Surge – HBAR recently saw a significant rally, showing just how much potential this project has. The momentum is real, but the question is: Can we hold these gains?
2️⃣ Golden Pocket Support – As of now, we’re seeing price action holding at the Golden Pocket on the Fibonacci retracement. This is a critical support level, and if it holds, we might see a bounce from here to push higher. 🔄
3️⃣ Demand Zone Fill – However, there’s another scenario. We could see a deeper retracement into the demand zone, which would bring us down to the 0.786 Fibonacci level. This could be a great opportunity to buy at a better price if you’re looking to enter.
So, what’s your move? Will the Golden Pocket hold, or are we heading for a deeper retracement? 💭
Let’s hear your thoughts! Drop them in the comments below, and don’t forget to follow for more updates on HBAR and other key altcoins.
Happy trading, everyone! 💰📈
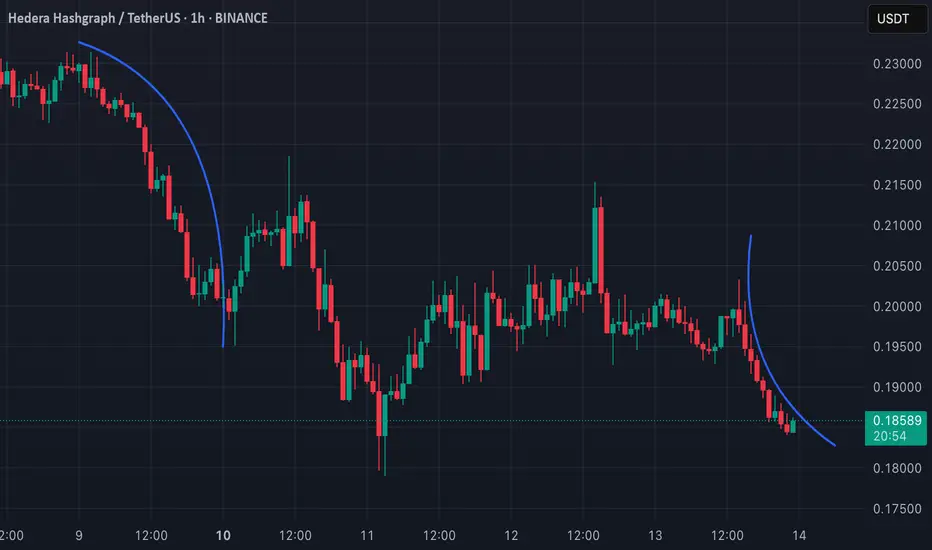
O kurwa! Curvature in Technical Analysis: What Does It Tell Us?Curvature in TA is trading approach where curved lines are used instead of traditional straight trendlines. Curved lines help to visualize how trends evolve and can provide insights into potential reversals or trend continuations.
One of the known methods that utilize curvature is the MIDAS (Market Interpretation/Data Analysis System). This system was developed by physicist Paul Levine in 1995 and uses curved support and resistance lines based on Volume-Weighted Average Price (VWAP). The curves adapt dynamically as price and volume change, helping to identify trend shifts and potential reversals.
💡 Why should we use Curvature?
Dynamic Support and Resistance: Curved lines adapt to price changes, unlike static horizontal lines.
Reversal Signals: They can signal potential trend shifts earlier than traditional methods.
Better Trend Visualization: They are particularly useful for parabolic or exponential price movements.
📊 Applying Curvature to HBAR (1H TF)
There are two curves on my chart. Both of them shows a curvature pattern forming on the 1-hour timeframe.
L: The curve on left side indicates a strong downward move, and the price appears to be following this curve closely.
R: On the other hand I have drawn curve on the right side, which is alligned as downward curve as well, but it has different angle.
This post is meant to test my theory on real life example.
🔑 Key Points:
Breaks away from the curvature could indicate a potential trend reversal or consolidation.
Combining this analysis with volume and momentum indicators can improve accuracy when predicting possible bounce or breakdown scenarios. Let's see how it works!
HBAR Hanging by a Thread! A Breakdown Could Be Brutal!Yello, Paradisers! Is #HBAR about to crumble under selling pressure? The charts are flashing red flags, and bulls are barely holding on! Let’s break it down.
💎#HBARUSDT is clinging to a crucial support zone between $0.1900 – $0.1785—a level that has held strong since December 2024. However, with repeated tests, this support is starting to weaken, signaling potential trouble ahead. Sellers are building pressure, and if bulls fail to defend the $0.1750 level, HBAR could face a sharp drop toward $0.1500, where a short-term short-squeeze might offer some temporary relief.
💎However, if selling momentum persists, the decline could extend further, dragging HBAR down to the $0.1300 – $0.1175 zone, where higher time-frame supports are present. This area is more likely to trigger strong short-covering and attract fresh buying interest, potentially setting the stage for a recovery.
💎On the upside, bulls are trapped under heavy resistance at $0.24, with a critical barrier at $0.26 – $0.275. Until this level is broken with conviction, HBAR remains vulnerable to further downside.
Paradisers, as always, patience and precision are key in this market. This isn’t a time for reckless trades—let the levels guide you, trade strategically, and stay disciplined.
MyCryptoParadise
iFeel the success🌴

Univers Of signals | HBARUSDT Better Condition Than the Market!👋 Welcome to the Univers Of signals channel!
Let's go together and examine one of the popular coins in the market that has experienced less correction recently and is in better condition than other altcoins!
📊 Weekly Timeframe
We go to the weekly time frame and see that hbar's condition is much better than other altcoins, and this is precisely due to the entry of momentum and Bitcoin's bullishness!
After we broke through the support at 0.04339 and engulfed the previous weekly candle, it was a bullish sign, and after the trigger at 0.06219 was activated, we broke this resistance and momentum entered this coin!
If you made your purchase in the spot section from this level, the situation is okay for now, but you can save profit or withdraw the principal capital. If you want to re-enter, you can make your purchase after the 0.33056 break.
📈 Daily Timeframe
In the daily time frame, we have higher levels and a better situation than the rest of the coins, and in a situation where most altcoins are forming lower bottoms, this has not even lost its main level.
After the 0.06470 and daily box break, we experienced a movement of about 500%, and if we draw a Fibonacci, we are currently at the 0.382 level, and this in itself increases the importance of this level! If the 0.37350 ceiling is broken, it shows us that we are going to experience a new movement!
This daily candle can be a good trigger to buy again, and the reason is that we are rising from a good support level and it is also a good Fibonacci level, but this trigger is risky and after the break of 0.26486 it will be a better trigger to welcome, and for a temporary exit, you can also temporarily exit with a break of 0.18653.
📝 Final Thoughts
Stay calm, trade wisely, and let's capture the market's best opportunities!
This analysis reflects our opinions and is not financial advice.
Share your thoughts in the comments, and don’t forget to share this analysis with your friends! ❤️

TradeCityPro | HBARUSDT Better Condition Than the Market!👋 Welcome to the TradeCityPro channel!
Let's go together and examine one of the popular coins in the market that has experienced less correction recently and is in better condition than other altcoins!
🌐 Overview Bitcoin
Before starting the analysis, I want to remind you again that we moved the Bitcoin analysis section from the analysis section to a separate analysis at your request, so that we can discuss the status of Bitcoin in more detail every day and analyze its charts and dominances together.
This is the general analysis of Bitcoin dominance, which we promised you in the analysis to analyze separately and analyze it for you in longer time frames.
📊 Weekly Timeframe
We go to the weekly time frame and see that hbar's condition is much better than other altcoins, and this is precisely due to the entry of momentum and Bitcoin's bullishness!
After we broke through the support at 0.04339 and engulfed the previous weekly candle, it was a bullish sign, and after the trigger at 0.06219 was activated, we broke this resistance and momentum entered this coin!
If you made your purchase in the spot section from this level, the situation is okay for now, but you can save profit or withdraw the principal capital. If you want to re-enter, you can make your purchase after the 0.33056 break.
📈 Daily Timeframe
In the daily time frame, we have higher levels and a better situation than the rest of the coins, and in a situation where most altcoins are forming lower bottoms, this has not even lost its main level.
After the 0.06470 and daily box break, we experienced a movement of about 500%, and if we draw a Fibonacci, we are currently at the 0.382 level, and this in itself increases the importance of this level! If the 0.37350 ceiling is broken, it shows us that we are going to experience a new movement!
This daily candle can be a good trigger to buy again, and the reason is that we are rising from a good support level and it is also a good Fibonacci level, but this trigger is risky and after the break of 0.26486 it will be a better trigger to welcome, and for a temporary exit, you can also temporarily exit with a break of 0.18653.
📝 Final Thoughts
Stay calm, trade wisely, and let's capture the market's best opportunities!
This analysis reflects our opinions and is not financial advice.
Share your thoughts in the comments, and don’t forget to share this analysis with your friends! ❤️

HBAR... make a decision already. HBAR is in a weird spot it either is going to make a complete 3-wave retracement through the volume gap, or get over-bought and move up. Regardless, of the way the chart looks it is most likely going to get a lower high without more volume. Spot is your friend.

HBAR Trading Update – March 5, 2025Most are sleeping on HBAR, but I am not. While the masses chase hype, I am positioned early for what could be one of the most explosive moves in the market.
The weekly structure is primed:
Break of structure (BOS) confirmed
Re-balanced price range tapped – inefficiencies cleaned
Swift x HBAR trial flying under the radar – yet to be priced in
High R:R setup for exponential gains
Trade Parameters:
Spot Entry: 0.2375 USDT
Spot Stop Loss: 0.1295 USDT (-49.62%)
Spot Target: 1.11 USDT (+327.50%)
Risk-to-Reward Ratio: 6.6R
Market Outlook:
Key liquidity levels are aligning perfectly with my projections.
Holding above 0.23 - 0.25 USDT confirms strength for continuation.
A breakout beyond 0.57 USDT (Old High) will ignite parabolic expansion toward 1.10+ USDT.
Failure to hold BOS structure would force a reassessment.
The institutional players are watching, and so am I. When the market finally catches on, I’ll already be in position.
Let’s ride this to 1.11 USDT! 🚀
Not financial advice.

A Strong Opportunity Based on Expert AnalysisThe highly anticipated launch of the HBAR cryptocurrency presents an exciting opportunity for investors and blockchain enthusiasts. HBAR, the native token of the Hedera Hashgraph network, is designed to provide fast, secure, and scalable decentralized applications. With the growing demand for reliable blockchain solutions, HBAR is poised to play a significant role in the crypto space.
As someone who has been closely analyzing the trends and technologies behind blockchain projects, I can confidently say that my analysis of HBAR's potential is extremely promising. The Hedera Hashgraph platform is built on a unique consensus mechanism that offers faster transaction speeds and lower costs compared to traditional blockchain systems. This innovative approach positions HBAR as a strong contender in the race to revolutionize industries such as finance, supply chain, and beyond.
In addition to its technical advantages, HBAR has been gaining strong support from reputable institutions, making it a project worth keeping an eye on. My deep dive into the project's fundamentals, as well as its strategic partnerships, has only reinforced my belief in its long-term success.
For those looking to make informed investment decisions, HBAR presents a highly attractive option, driven by cutting-edge technology and an innovative approach to decentralized governance. Based on my thorough analysis, I have no doubt that HBAR is on track to become a dominant force in the world of cryptocurrency.
Mvh Mert Arslan

HBAR - 50% - 250% Bounce IncomingMartyBoots here , I have been trading for 17 years and sharing my thoughts on ADA here.
HBAR is looking beautiful , very strong chart for more upside
Very similar to the last time when it bounced 250%
Do not miss out on HBAR as this is a great opportunity and is setting up in the near future
Watch video for more details

($HBAR) Analysis
🔸 #HBAR rebounded strongly by 30% from a key support level, reinforcing the likelihood of continuing the bullish wave
🔸 A Double Bottom formation is in play, a bullish pattern indicating a potential trend reversal.
🔸 Breaking through the liquidity zone highlighted in the chart could pave the way for higher levels.
🔸 A breakout above $0.29578 will confirm further gains toward $0.41618.

HBARit looks like HBAR is going to pump hard, if you see on 3D tf, you will understand that it is just the beginning of the way up.
lets see how this will develop....
spot trade
NFA
DYOR
