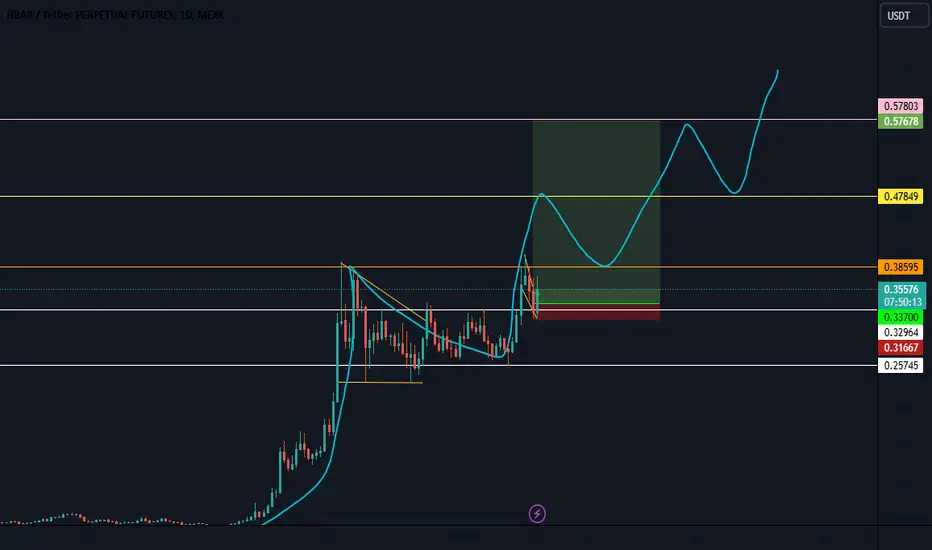
HBARUSDT Preparing for a long moveEllipse has been identified looking for a pull back area.
Get ready for this trade...
If the pull back area shows bullish pattern... Close your eyes and hop on this ride with me..
Will keep you updated...
why am i saying to long at this area... as the ellipse has been identified and its breaking down so it might be a fake out before the big move...
The pull back area needed to show bullish patterns...
DYOR
HBARUSDT trade ideas

Tradecitypro | HBAR: Momentum, Key Levels, and Future Targets👋 Welcome to Trade City Pro!
In this analysis, I’ll be reviewing the HBAR coin, which belongs to the Hedera project. This coin operates in the DeFi and RWA categories and also features a Layer 1 network.
📅 Weekly Timeframe
On the weekly timeframe, we observe a powerful bullish leg that began at the 0.04226 level and extended to 0.33994, marking an impressive 700% growth.
🔍 The 0.33994 level serves as a critical resistance, closely aligned with the 0.44075 resistance, creating a highly significant supply zone between these two levels.
✨ Currently, the price has been rejected twice from this area. In my view, this is a healthy development for the bullish trend, as corrections are essential for sustained growth. Considering the 700% surge over a few candlesticks, this pullback likely helps close long positions and strengthens the trend's foundation.
📊 Market volume has also been decreasing during this correction, signaling alignment with the bullish trend. Additionally, the RSI is exiting the overbought zone, paving the way for the price to establish a new structure and potentially resume its upward movement.
🔼 If the 0.44075 resistance is broken, the price could achieve a new all-time high (ATH). To determine specific targets, we need to wait for this resistance to break and use Fibonacci levels based on the recent corrections.
📉 In case of a deeper correction, the 0.13023 level will be the most critical support. This area has shown strong reactions in the past and can act as a solid support during significant pullbacks. The 0.19647 level could also provide support, but the primary level remains 0.13023.
📝 Final Thoughts
This analysis reflects our opinions and is not financial advice.
Share your thoughts in the comments, and don’t forget to share this analysis with your friends! ❤️

Hedera (HBAR) Life Cross, not what you thinkA Life Cross has printed on the above 6 day chart after an explosive 700% rally.
A Life cross is often seen as a positive development for fans of moving averages. However a word of caution is advised, moving averages do not inform about the future, they inform you only of what has been.
A number of reasons now exist to be bearish on HBAR, they include:
1) Past RSI support confirms resistance.
2) Price action is at monthly resistance. Look left.
3) Regular bearish divergence. Just as before look left, you think this time is different?
4) All tradingview.com ideas are long:
www.tradingview.com
This will be the only short idea you’ll be reading tonight. Remember the the 90% are here to lose money, are you?
Is it possible for price action to continue up after 700%? Sure.
Is it probable? No.
Ww

HBAR +20% on the waymanage your risk and enjoy the ride.
it's on a nice support area and ready to fly.

HBAR/USDT AnalysisAfter breaking out of the resistance zone and pulling back, the price now looks like it will bounce.
🎯 Targets:
1️⃣ First Target: Green line
2️⃣ Second Target: Blue line

HBARUSDT BULISHRight now, we don’t have any sharp movements in most of the charts, so we can manage and reanalyze the same charts again.
Here is the new analysis for HBARUSDT.
Note: My ideas are not intended for any type of scalping or scalpers!
Here are my other ideas:

HBAR DistributionAnother deviation above the high could confirm a model 1 which would take us at least to the low of the range where also a liquidity curve forms, so watch out for that.(it gets invalidated if it strongly pushes above)

HBAR has formed a flag!BYBIT:HBARUSDT
Hbar has formed a flag which means the price will start to increase soon.
The price will increase after the break out happens!
⚠️ Disclaimer:
This is not financial advice. Always manage your risks and trade responsibly.
👉 Follow me for daily updates,
💬 Comment and like to share your thoughts,
📌 And check the link in my bio for even more resources!
Let’s navigate the markets together—join the journey today! 💹✨

HBAR - 24 jan. updateHey,
It seems like HBAR is buckling up for a potential growth, but the key question is: will we see a correction first?
Currently, HBAR is trading between 0.618 and 0.5 Fibonacci levels, a range associated with indecision. If the bears manage to take control in the coming days and push the price below the 0.3 and reach 0.5 Fib zone, we might see a healthy correction before a bounce. However, with positive market catalysts like ETF approvals or broader bullish sentiment, HBAR could quickly recover above 0.5 Fib and aim for 0.886 Fib as the next target.
While the global uptrend is still with us, it’s worth noting that HBAR is in a local downtrend channel, which supports the possibility of a short-term pullback.
History has shown us that during the previous cycle, HBAR reached 0.45 before falling sharply to 0.14, losing over 70% of its momentum during the correction. This is a reminder to remain cautious, as larger corrections can still happen before hitting ATH, as it was in 2021 cycle.
For now, let's keep an eye on how the 0.618 and 0.5 Fib zone reacts in the upcoming days. Whether we break out or see a deeper correction, risk management is the key.
IMHO, It's a still good entry point for spot and low margin futures traders.
📉 Short-term: Monitor the local downtrend channel.
📈 Mid-term: A break above 0.618 could lead to retesting 0.886 Fib.
Stay hungry and trade smart! 💹

HBAR - Swing to SupplyLittle retest on the trendchannel. Bouncing of off Demand-Zone. Running into the Supply Zones. TP on the way.
Manage your risk properly.

HBAR/USDT: LONG SCALP SETUP!!🚀 Hey Traders! 👋
If this setup gets you hyped, smash that 👍 and hit Follow for trade ideas that deliver results! 💹🔥
HBAR is heating up! Breaking out of a falling wedge structure, signaling a strong bullish move ahead. 📈🔥
💡 Here’s the Setup:
📌 Entry Range: Current Market Price (CMP)
🎯 Targets:
Target 1: $0.355
Target 2: $0.386
Target 3: $0.418
🛡️ Stop Loss (SL): $0.325
⚙️ Leverage: 5x–10x (trade responsibly!)
💬 Your Thoughts?
Are you bullish on HBAR’s breakout potential? Share your analysis, predictions, or strategies in the comments! Let’s ride this wave and secure those gains together! 💰🔥

#HBAR Big move My anylysis Indicate that the coming weeks will be the weak of alt coins specialy Hbar It go down for correction 0.29 and then big move will happen keep on the eye and DOYOR this is my idea if you agree like it

Hbar Can Retest roof againHello traders
in this chart I will go Long Postions as soon as price make a higher high
also consider that this is not financial advise its analysis of this chart and my Point of View

HBAR BULL RUNMy technical anylysis toward #Hbar is going to 0.60
One day time frame if you agree like it
#hbar #crypto
HBAR/USDTKey Level Zone: 0.3160 - 0.3320
HMT v4.1 detected. The setup looks promising, supported by a previous upward/downward trend with increasing volume and momentum, presenting an excellent reward-to-risk opportunity.
HMT (High Momentum Trending):
HMT is based on trend, momentum, volume, and market structure across multiple timeframes. It highlights setups with strong potential for upward movement and higher rewards.
Whenever I spot a signal for my own trading, I’ll share it. Please note that conducting a comprehensive analysis on a single timeframe chart can be quite challenging and sometimes confusing. I appreciate your understanding of the effort involved.
Important Note :
Role of Key Levels:
- These zones are critical for analyzing price trends. If the key level zone holds, the price may continue trending in the expected direction. However, momentum may increase or decrease based on subsequent patterns.
- Breakouts: If the key level zone breaks, it signals a stop-out. For reversal traders, this presents an opportunity to consider switching direction, as the price often retests these zones, which may act as strong support-turned-resistance (or vice versa).
My Trading Rules
Risk Management
- Maximum risk per trade: 2.5%.
- Leverage: 5x.
Exit Strategy
Profit-Taking:
- Sell at least 70% on the 3rd wave up (LTF Wave 5).
- Typically, sell 50% during a high-volume spike.
- Adjust stop-loss to breakeven once the trade achieves a 1.5:1 reward-to-risk ratio.
- If the market shows signs of losing momentum or divergence, ill will exit at breakeven.
The market is highly dynamic and constantly changing. HMT signals and target profit (TP) levels are based on the current price and movement, but market conditions can shift instantly, so it is crucial to remain adaptable and follow the market's movement.
If you find this signal/analysis meaningful, kindly like and share it.
Thank you for your support~
Sharing this with love!
HMT v2.0:
- Major update to the Momentum indicator
- Reduced false signals from inaccurate momentum detection
- New screener with improved accuracy and fewer signals
HMT v3.0:
- Added liquidity factor to enhance trend continuation
- Improved potential for momentum-based plays
- Increased winning probability by reducing entries during peaks
HMT v3.1:
- Enhanced entry confirmation for improved reward-to-risk ratios
HMT v4.0:
- Incorporated buying and selling pressure in lower timeframes to enhance the probability of trending moves while optimizing entry timing and scaling
HMT v4.1:
- Enhanced take-profit (TP) target by incorporating market structure analysis

Hbar We had a breakout , and a retest right now of a strong support level .
If it manages to hold above .
I see a move towards the 0,6-0,7$ target .
Short term .


HBAR’s Next Support and Resistance TargetsHBAR hit a key high at $0.3922 but faced rejection, suggesting the formation of a trading range or a potential ABC corrective structure. A developing head and shoulders pattern further signals possible bearish momentum in the short term.
Key levels and trade setups:
Short Setup:
Entry: Around the 0.618 Fibonacci retracement of the current wave
Stop Loss: Above the $0.3922 key high
Take Profit: Targeting the Fib Retracement 0.382 at $0.34356
R:R: A favorable 5:1 if taken from the 0.618 retracement or 2:1 when entering after losing the dOpen
Support Zone:
Anchored VWAP, weekly level and Fibonacci speed fan 0.618, depending on timing, align near $0.34356–$0.33284. This confluence provides a robust area for potential price bounces.
Long Setup:
Entry: Within the support zone, contingent on bullish confirmation
Stop Loss: Below the support zone

Hedera (HBAR): Bullish Channel Targets $0.45+📈 Hedera (HBAR): Eyeing a Breakout – Here’s What to Watch 🚀📊
Hedera Hashgraph (HBAR) is holding strong within a bullish channel on the 12H chart, with the price consolidating near a critical level. The key resistance at $0.45 could be the gateway for a breakout toward higher levels, while a pullback to support zones remains a possibility.
Technical Setup:
Bullish Channel Formation: HBAR is steadily trending upward, respecting the mid-line of its channel.
Key Resistance: A breakout above $0.45 could lead to the next major target at $0.62.
Pullback Potential: Failure to break through might lead to a retest of $0.20, offering another buying opportunity.
Why Hedera is Thriving Fundamentally:
Institutional Backing: Grayscale’s interest in HBAR hints at growing institutional adoption.
Ecosystem Growth: With over 30 billion transactions, Hedera showcases unmatched scalability and real-world utility.
DeFi Advancements: Collaborations like Chainlink’s Proof of Reserve integration position Hedera as a leader in decentralized finance.
ETF Speculation: Rumors of an HBAR ETF are fueling excitement, adding bullish sentiment to the market outlook.
Hedera is carving its space as a powerful force in blockchain and Web3. With both technical and fundamental signals aligning, this could be a big year for HBAR! What’s your outlook on Hedera’s future? Share your thoughts below. 👇
One Love,
The FXPROFESSOR 💙

HBAR potential risk of -80%HBAR shows signs on the 4H and 1D timeframe of a potential risk of -80% price decline due to a double top formation. BTC price goes down (see my other chart) HBAR will probably will go down too. I see many crypto's on my watchlist showing signs of a potential big price decline. In stead off all the positive messages in the media. So be carefull. Really strong bullish trends are not confirmed yet for none of the crypto's on my watchlist.

Hedera (Buy)The first target is the size of the largest side of the triangle. Are we in agreement soon?

HBAR Analysis and Future OutlookHello, Traders!
The HBAR price demonstrated an impressive rally, surging by 850% in just one month, followed by a natural correction phase. After retracing over 35% from its local top, HBAR managed to recover all losses and established a new local high at the $0.4 level, showcasing strong bullish momentum.
Current Price Dynamics:
It appears that HBAR has already formed its local bottom, and the price is preparing for a potential breakout to higher levels.
However, it has now entered a critical resistance zone ranging from $0.4 to its ATH, which currently stands at $0.575.
Breaking through this zone will require significant buying pressure, but the token recent performance suggests that the market sentiment remains highly optimistic.
Market Sentiment and Hype:
With increasing hype and attention around HBAR, driven by its technological advancements and ecosystem developments, there's a high probability of the token achieving a new ATH within the next couple of months.
Entry Points and Strategy:
For those who missed the previous correction phase, it's advisable to wait for another potential retracement around the $0.3 level, which could provide a solid entry point.
From there, setting targets above $0.6 would be a realistic strategy, given the current bullish outlook and market conditions.
Key Levels to Watch:
- Resistance: $0.4–$0.575 (ATH)
- Support: $0.3 (potential retracement)
- Target: $0.6 and beyond
Please don’t forget to boost this idea and leave your comments below.

HBAR/USDT: A Potential Super Long-Term Impulse Wave Take a look at this super long-term potential impulse wave for HBAR. This chart captures a massive Elliott Wave structure that could define the next big move in the crypto market.
We’re seeing the foundation of Wave 3, with the potential for a trend-defining breakout as HBAR progresses through its impulsive phases. The critical zone? A breach of the upper trend line would validate this structure and could signal higher highs on the horizon.
This isn’t just a week-to-week setup—it’s a multi-year roadmap. If the Hurst cycles align, we’re looking at one of the most promising long-term plays.
What’s your take? Do we see confirmation, or does this remain a dream scenario? Share your thoughts and follow for more long-term crypto insights! 🚀
