Breakout Strategy for HEI/USDT: Key Resistance TestedBreakout Strategy for HEI/USDT: Key Resistance Tested
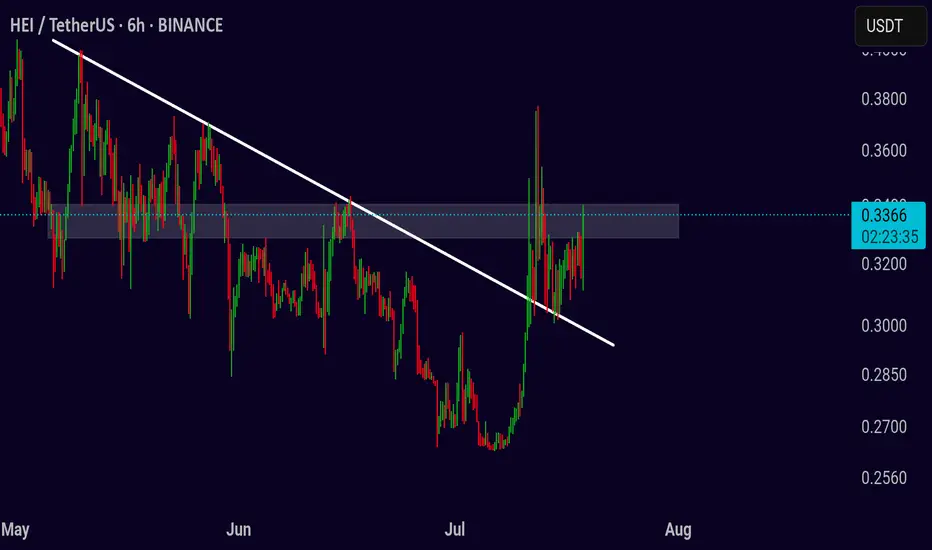
The HEI/USDT chart is currently consolidating under a clear descending trendline, signaling a potential breakout. As price approaches this key resistance, the market is poised for a critical move. Will HEI break higher or continue lower? Let’s break down the potential scenarios.
Bullish Breakout Opportunity
If the price breaks above the 0.3500 resistance level, it could trigger a bullish breakout. A strong move above this resistance would signal increased buying momentum, with target levels at 0.3700, 0.4000, and possibly even 0.4400. Placing a stop loss just below 0.3200 will help protect against a failed breakout. Always monitor volume during the breakout, as an increase in volume confirms the strength of the move and validates the breakout.
Bearish Breakdown Risk
If the price fails to break above 0.3500 and drops below the 0.3200 support, it could signal a bearish breakdown. In this case, shorting the market may be considered, with target levels around 0.3100 and 0.2900. A stop loss just above 0.3350 will provide a safety net. Again, volume plays a key role—low volume on the breakdown may indicate a false move, so keep an eye on it.
Pro Tip
Volume is the most reliable indicator to validate the strength of both breakouts and breakdowns. A surge in volume during either move adds confidence to your trade. Make sure to manage your risk with well-placed stop losses and adjust your position size according to the market conditions.
Focus on price action, and be prepared to act quickly as HEI/USDT nears its breakout point. Whether the price breaks higher or lower, this strategy will help you stay ready for either outcome.
HEIUSDT trade ideas
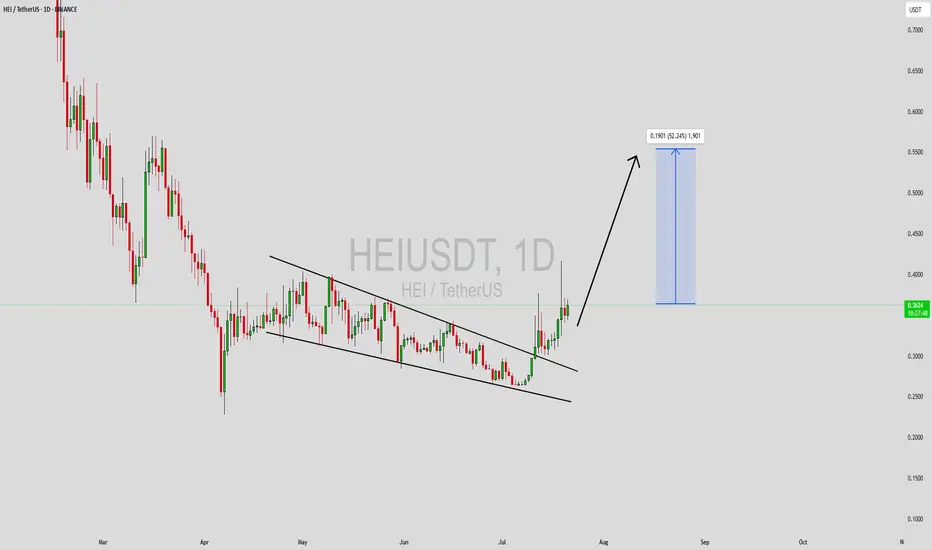
$HEIUSDT Bullish Setup.$HEI/USDT has broken out of a long-term downtrend on the daily chart.
After a successful retest, it’s showing bullish momentum with a potential 170% upside toward the $0.8000 zone.
DYOR, NFA

HEI/USDT – Bullish Breakout Confirmed, More Upside Ahead?
Date: July 19, 2025
HEI/USDT has just broken out of a prolonged accumulation phase with strong volume confirmation. The price is showing strength as it reclaims key moving averages and breaches horizontal resistance, suggesting a potential shift in trend.
🔍 Technical Overview:
Current Price: $0.3681
EMA Analysis:
4EMA: $0.3234
50EMA: $0.3048
100EMA: $0.3267
Price is trading above all short-term and mid-term EMAs, indicating a confirmed bullish momentum.
📊 Structure & Price Action:
A solid base was formed between $0.25–$0.35, marked by accumulation and higher lows.
The recent breakout above the $0.36–$0.38 resistance zone is significant, especially backed by high volume.
The structure appears to be a rounded bottom / cup-shaped pattern, hinting at a shift from a downtrend to an uptrend.
📉 Key Support Zones:
$0.3545 (immediate support / previous resistance now turned support)
$0.25–$0.30 (accumulation demand zone)
📈 Key Resistance & Target Zones:
$0.4018: Minor resistance just ahead, being tested
$0.4380: Local horizontal resistance
$0.5704: Final mid-term target if bullish momentum continues
📊 Indicators:
RSI: 71.25 – Strong bullish momentum, now in overbought territory. Could lead to short-term consolidation before next leg up.
Volume: Strong breakout candle with a surge in volume – confirms genuine demand and institutional participation.
🎯 Bullish Outlook:
Breakout confirmed with clean structure and momentum
Short-term target: $0.4018
Mid-term targets: $0.4380 and $0.5704
Pullbacks to the $0.35–$0.36 zone may present buying opportunities
📉 Invalidation:
A breakdown below $0.3545 (with volume) would weaken the bullish thesis
Falling back into the accumulation zone below $0.30 would invalidate the breakout setup
Good Trading!!

Heima Bullish Breakout, Easy 179% PP Short-Term (L-HL)The chart isn't giving us much so I will not go into technical analysis; but this is a bullish setup, one that has the potential to break-up just as Hyperlane did. If you are unaware, HYPERUSDT just grew ~200% in a matter of hours... The altcoins market is starting to heat up.
Here we have Heima, a new project.
There is a big A&E bottom formation. The 7-April low is very pronounced. There is also the classic L vs HL. The ending diagonal is a bullish pattern as well and the action is reaching the apex, a breakout can happen anytime.
179% profits potential short-term.
Try to avoid using your rent money to trade, it can lead to disaster. Just a friendly reminder. Use only money that you can afford to lose.
This chart setup is low risk. Everything spot is very low risk. The risk is only as much as you define or allow. You can cap it at 5%, 10%, 20% or any amount you want. Easy buy and hold. The expectation is for a fast-strong move. Buy, sell, collect profits move on to the next trade. That's what we mean by short-term.
Loses are inevitable. Wins as well.
Win big, lose small. It will lead to success.
Follow a plan. Develop the habit of winning. If you can win, win, win. Win small; eventually you will win big. Step by step. Persistence and consistency.
Thank you for reading.
Namaste.

HEIUSDT Forming Falling WedgeHEIUSDT is currently showing a textbook falling wedge pattern—a bullish reversal setup that often precedes sharp upside breakouts. This formation is defined by converging downward-sloping trendlines, signaling weakening selling pressure and the potential for a trend reversal. As HEI trades closer to the wedge’s apex with rising volume, market participants are beginning to anticipate a breakout that could lead to significant upward momentum. A confirmed breakout above the upper trendline would validate this bullish outlook and trigger renewed interest from traders.
Technically, falling wedge patterns are known for offering high-probability setups, especially when backed by volume growth and strong investor sentiment. HEI’s recent price action suggests accumulation at support zones, with bulls defending key levels repeatedly. This behavior indicates that smart money could be positioning for a move higher. Based on historical breakouts from similar wedge structures, a price gain of 40% to 50%+ is a realistic target in the short to mid-term.
Investor interest in HEI is gradually increasing, as seen through improving volume metrics and social media buzz. As more traders recognize this setup, the potential for a breakout rally becomes stronger. HEI’s fundamentals and potential utility within its ecosystem further support a bullish case, making it a coin to watch closely in the coming weeks. If the breakout confirms, it could attract significant trading volume and price momentum.
✅ Show your support by hitting the like button and
✅ Leaving a comment below! (What is You opinion about this Coin)
Your feedback and engagement keep me inspired to share more insightful market analysis with you!
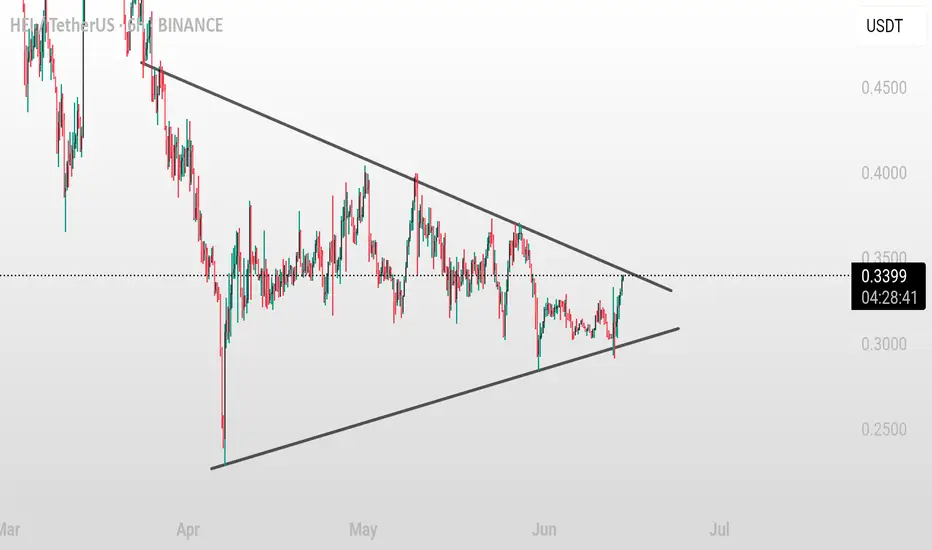
HEI/USDT – Symmetrical Triangle Squeeze Ahead of Big MovePair: HEI/USDT 💱
Timeframe: 6H ⏱️
Pattern: Symmetrical Triangle Consolidation 🔺
HEI has been coiling tightly inside a symmetrical triangle since April, with price nearing the apex. This setup usually precedes a strong breakout or breakdown. Momentum is building — a major move looks imminent 🔍🔥.
Bullish Breakout Scenario ✅
A 6H candle close above 0.36 confirms breakout:
🎯 Target 1: 0.45
🎯 Target 2: 0.55
🛑 SL: below 0.29 (recent swing low)
Bearish Breakdown Scenario ❌
A 6H candle close below 0.31 confirms breakdown:
🎯 Target 1: 0.20
🎯 Target 2: 0.12
🛑 SL: above 0.35 (recent swing high)
⚠️ Wait for confirmation with strong volume — this move could be sharp and decisive.
HEIUSDT Falling Wedge Pattern Targets 150%-160% Gains!HEIUSDT is currently forming a strong falling wedge pattern, a classic bullish reversal signal. The price has been consolidating within this wedge for some time, and we are now starting to see a breakout attempt with good supporting volume. This setup is gaining attention among investors who are looking for promising opportunities in the altcoin market.
Volume has notably increased, suggesting strong buying pressure is building up. Historically, falling wedges often lead to explosive upward moves once a breakout is confirmed. In this case, the projected gain is around 150% to 160%, which makes HEIUSDT a very interesting pair to watch in the coming days and weeks.
Many traders are keeping a close eye on HEIUSDT due to the solid technical pattern and growing market interest. If momentum continues and broader crypto sentiment remains positive, this breakout could lead to substantial price appreciation. Risk management is key, but the potential reward here looks highly attractive.
✅ Show your support by hitting the like button and
✅ Leaving a comment below! (What is You opinion about this Coin)
Your feedback and engagement keep me inspired to share more insightful market analysis with you!
