A buyI see a buy, several bottoms here before. Under the recent trend line. If you want to know.... hex.watch
So there it says that with the current supply:
1 eHEX == 50¢: $3.74M (913.11 ETH)
1 eHEX == $1: $11.82M (2.9K ETH)
eHEX market cap > ETH market cap: $8.3M (2K ETH)
eHEX market cap > BTC market cap: $21.33M (5.2K ETH)
That means that more stakes ensure more price security. Interest is good, this interest includes weak hands paying out to strong hands as well as interest. The gatekeeping is ending, the interest is good so long as there are no hacks or downtime. What could cause downtime, that is the question I suppose, but for now I see this and if BTC and all the rest crash down, still SOME amount of hex can not be sold, at least not without paying the stakers.
HEXUSDC_F6DCDC trade ideas

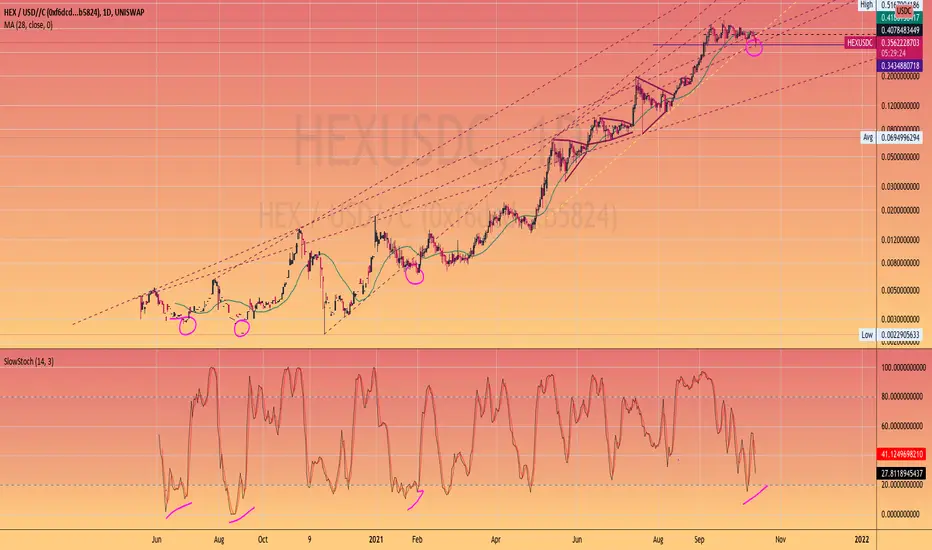
HEXUSDC Daily Chart Prediction with Wykoff AnalysisThis prediction is based of the apparent recent Wykoff distribution by forecasting a Wykoff accumulation. It assumes the long term trend line will hold support, yet perhaps seems a little bearish given the indicators shown below it. This is due to the number of upcoming end stakes. At this point new all time highs for the end of the year remain in play.

HEX/USDC Elliot Wave Analysis Update correction time.On July 23rd I made an Elliott Wave Analysis that called for a correction around the $0.50 - $0.70 cents range. This analysis is now being fulfilled and in this picture I will zoom out and show my analysis for the entire HEX Bull-run cycle. When studying charts it is never a good idea to use a linear chart view unless you are analyzing corrections. The logarithmic chart will show you a better view of whats happening.
Right now we are in a correction phase for wave 4 (blue) and this should be a zigzag correction. Wave 4 is normally a zigzag according to Elliot Wave theory especially since wave 2 was a flat. ZigZag's are normally sharp moves and they are 5 waves down 3 waves up, and then another 5 waves down an A-B-C We should be getting a relief rally soon for the 'B' wave here but then another sell-off will come finishing the 'C' wave before gaining support likely between $0.16 and $0.19c
After this we will be completing the 5th and final leg of Wave 3 (colored in white) during this time HEX will likely go viral and then there will be a bigger Wave 4 correction (in white) and the the final leg of the bull run is wave 5 (white) after this HEX should go into a correction for at least a year.
-----
I do not see the bull run ending as of now because there is no MACD divergence yet. MACD divergence (When the Price makes a new High but the MACD Oscillator makes a lower high) is a tall-tale sign that the trend is ending. The RSI is about to bottom-out so a relief rally should come soon.
Happy trading!

Still on Target HEX/USDC end of bull run is still months off.We are still on-target in my Elliot Wave analysis on HEX/USDC the Ethereum token which functions as a store of value with a yield rewards for those who stake their coins. We just finished the 5th wave of the smaller cycle (red) impulse. We have also seen a fast zigzag correction drop back to between 7 and 8 cents for wave 4 of the larger cycle (blue). This may retrace again to make a larger 3 wave correction (WXY) and then the larger cycle will go for its wave 5 and terminate somewhere around $0.50-$0.70 cents. Then we will dip down for a supercycle wave 4 (white) with a WXY correction. Lastly followed by the last bull-run which is supercycle (white) wave 5 which should see a target of between $1.40 and $2.20

HEX final leg before deeper correctionStill bullish sentiment on HEX/USDC as we have been consolidating for nearly a month now. My Elliot Wave Analysis is still the same but now with a higher target for this wave 5, it looks like we are winding up for an extended wave 5 here which will move very fast. We have satisfied the rules for a ABC or "Flat" correction with the C wave as an ending diagonal for wave 4.
I am expecting the bullish trend to continue and my target is around $1.60.
The reason why HEX can get this and even much more expensive is because there is only roughly 80 to 90 million HEX left to buy on the market. Once this HEX starts to go away the ratio of HEX available to USDC in the liquidity pools will continue get lower and price will keep getting higher and higher because of it. This coin was engineered to do insane gains like Bitcoin, why? Because the available HEX anyone can buy from the liquidity pools is scarce. Eventually supply will be replenished from Stakers who dump inflation on the market which is EXACTLY how Bitcoin functions with supply and demand. Do not be surprised one day to wake up with $500 HEX years down the road. Thinking about HEX in terms of Market Cap is backwards thinking. Market Cap doesn't have anything to do with available supply. If supply is smaller than demand, supply has to be split up in order to satisfy the demand, thats inflation 101 and its as simple as that.

$HEX is DUMPING! Any hope in the charts!?$HEX has been in a very strong downtrend after breaking down from the symmetrical triangle. However, price is now showing some signs of support along this key long-term price trend line. Additionally, we can see potential bullish divergence on RSI along with RSI showing signs of support along a RSI trend line. This looks like a great area for accumulation.

$HEX - One Long Ass Trend Line to Rule them AllWill this key long-term trend line hold as support once again? If so, this would be one epic dip to buy!
-Bullish Divergence on RSI
-Long-term trend line support
-Long-term RSI trend line support
-Price looking like we could see some sideways consolidation

Hidden Bullish Divergence on HEX#HEX This has been the first time HEX is showing this DEADLY combination of hidden bullish divergence:
Hidden Bullish Divergence on MACD + Hidden Bullish Divergence on RSI + Price below the 50 EMA
The combination of these 3 items is VERY VERY BULLISH.


Hex forecast and possible bullish momentum- resistance break on hourly, if closes above on daily, likely will head to $1

When #HEX has shown positive divergence on the Stochsshowing lower prices
But the stochs are divergent
let's see if they HOOK up in the coming days
BE excited its only happened a few times before
double your stakes and coins on the upcoming #ETH fork
where will HEX be by then???
I say higher much higher

HEXUSDC EOY
Upcoming airdrop of *most all* ERC20 tokens and snapshot / chain split of;
the entire Ethereum Blockchain system state for PulseChain.com
Hex token will have usability on Pulse Chain from launch;
allowing you to stake for reward$.
Coming fast Coming soon.
*Known Scams Excluded*

HEX - The highest appreciating assetHEX is designed to be the highest appreciating asset of all time. It is never too late to get into hex.

I see the Future of HexHex is the best chart ever.
Its the highest appreciating asset in the history of man kind.
Up and to the right. This is not financial advice. DYOR

Previous Hex post was Heiken Ashi candles, this is normal candleSee great long trade setup coming - read previous post.

Hex non-stop easy beautiful setups for entire history of hexJust buy every descending wedge or pattern breakout and set very tight stop and trail it up.
If stopped out, buy the next breakout.
Target for hex for this bull market is $1.30-$3.

HEX on the weeklythoughts? wave 5 of 1 ending around $26 but bad and good news is down to around $0.10 cent for wave 4

RSI drops below 50The last 3 moves based on RSI dropping below 50. HEX tends to see massive pumps after every visit below 50 on the daily RSI

$HEX About to Lose 'Critical' Support?$HEX just lost support and is looking like it will see further downside. Price action is looking OK, but if price drops below the next 'critical' support zone , $HEX could see some serious downside!

$HEX Setting Up for Huge Move to New ATHWe can see that HEX has been consolidating in this triangle formation for a few weeks after a healthy bull run. I suspect we'll break this consolidation to the upside and see a new ATH in coming weeks.

HEX 7.4 RRR longTrading Methodology:
1. An asymmetric bullish / bearish pennant is drawn using ascending and descending curved trend lines with a minimum of three price action touche points per line. The direction is determined by the previous trend.
2. The angle tool is applied from the earliest two trend touch points, beginning at the earliest touch point.
3. A trend-based Fibonacci retracement triangle is drawn starting from the earliest trend touch point and ending at the earliest touch point of the opposite trend line .
4. Based on the degree, of the earlier defined angle, the appropriate (and secret) levels are selected for the fibonacci retracement ; two levels for stop-loss and two levels for take-profit. The closest stop-loss level to the current price level is the top priority stop-loss. Though the secondary stop-loss level is often chosen for some markets such as FX and some equities in order to account for seldom unexpected resistance breaks. The greater target level is the top priority, and where majority of the shares are sold, though some may choose to close part of the position at the first target level or set it to be the stop-loss once price exceeds it. Entries should be laddered in around the levels closest of the yellow line.
This trading strategy can be applied to any market and time frame, and positions most often garner the greatest risk-to-reward ratio with the highest success rate. What more can you ask for? I will only be posting my unique trading strategy until EOY. I work solely with price action to identify pennants and apply unique trend-based fibonacci retracement levels for SL and TP levels. Reach out to me if you have any questions.

