HEXUSDC_F6DCDC trade ideas

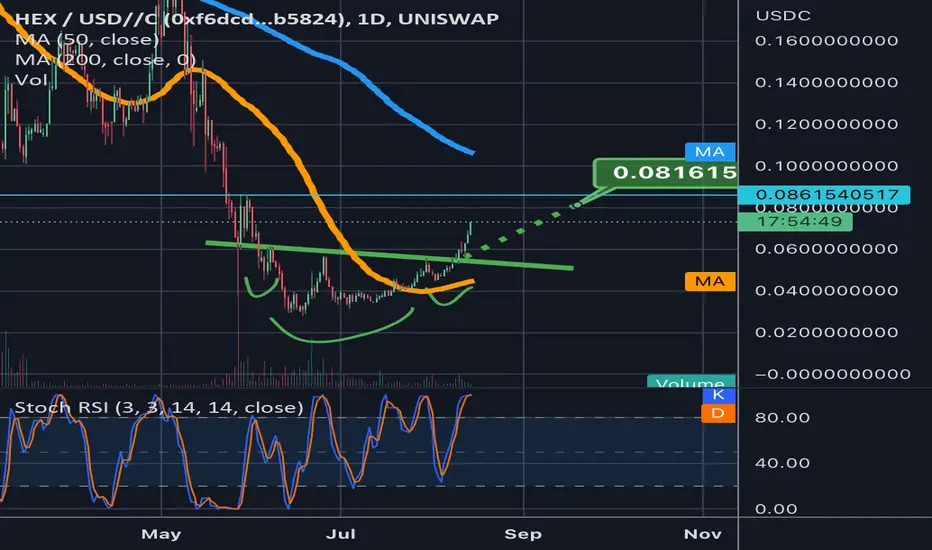
HEXUSDC pair appears to be confirming inv h&S breakoutI don’t own any Hex. It’s not on any exchanges I typically use and have not used anything like uniswap before so its unlikely I will ever own some. Knowing Richard Heart, it wouldn’t surprise me if this thing eventually became some sort of Ponzi scheme. However also knowing Richard Heart’s resilience, it wouldn’t surprise me if the previous ath it had will be its final ath. I wouldn’t be surprised if it found a way on the next big bull impulse to even double that ATH or higher. So if it did happen to appear upon an exchange I used at these current price levels I would probably grab a small amount just in case it were to retest its ath or surpass it. It already is going to make a 50% gain just by hitting the current inv h&s measured move breakout target. From there I could see it inching a little higher to test the teal horizontal or just correct right at the target. Either way once it corrects it will start forming the right shoulder to an even bigger inv h&s pattern which will have an even bigger measured move breakout target. This is not a crypto I’d ever consider buying at the prices it was at during the previous top but right now could be an opportune risk/reward ratio to roll the dice on Richard Heart being able to milk this project at least one last uptrend. *not financial advice*
HEXUSD bullish scenarioGood day fellow traders!
Looking pretty bullish for hexusd. Looks like it's about to break through a long term resistance. Charts shows possible price action trajectories and targets.
EMI 2: Money flow velocity is increasing. Meaning more and more money entering the market while less and lesser money is leaving the market.

#HEX primed to pump! Heading to 7.6 cents. A near 50% Move!Bullish Hunt Volatility Funnel has formed.
The slow grind up is turning into Bullish upward pressure being built.
Expect a quick rise into the 7 cent area.
@TheCryptoSniper

HEX daily is ready to RIP FACE!!!!!!!HEX daily zoomed in...HEX is looking extremely
bullish to me...not only awaiting PULSECHAIN
AND PULSEX launch soon, but its wanting to
break out of the Triangle and it may retest
support in the green circle then move up to
the $0.10 mark. Once we break that $0.10 price
HEX then could reach much much higher.
RSI looks great too

HEX weekly chart Broke Bullish out of the TriangleHEX weekly has broke out of the
Triangle and looking toward the
$0.056 and then $0.07 then $0.085
then $0.10 the RSI is just coming off
of being Oversold.

Full buy signal on HEXHex has given a full buy signal on the daily timeframe. However, the past two previous times these have been false breakouts. We are still in a bear market and these types of false breakouts are common in these market conditions. Is there enough there in my opinion to increase the position size? Yes. However, since we are in a bear market be sure to manage that position sizing to reflect that.

HEX small Golden Cross post Pi Cycle BottomHEX dips 22.6% post Pi Cycle Bottom, resulting in bullish TD reversal indicator and small Golden Cross on 12-hour chart.
Foolish Byrne...

HEX weekly chart is still intact and waiting for PLS launchHEX WEEKLY CHART:
upon waiting for the PLS (PULSECHAIN) launch
we have been in a huge downtrend...Once we
here from Richard Hearts new Project PLS launch date,
is when this chart will turn bullish. Thats the
truth...The long rectangle support box must hold
or this chart will need a Scuba Suit. RSI IS WAY
OVERSOLD!

Second buy signal on HEX. Time to increase positionThere a second buy signal on HEX against USDC, this will increase the position from the first signal and move the buy average down a small bit. We wait now for a hard buy signal to go in with bigger size on this position.
#HEXUSDC WITH A BIG MOVE COMINGHEX is looking another big move coming. We have a symmetrical triangle about to breakout on the daily chart and a tight squeeze forming on the Bollinger Bands. If I were to give my OPINION on which way HEX was heading, I would say further down (like the rest of the crypto market). But this is one that I would keep my eyes on in the short future. When crypto finds its bottom, this will be one of the stronger front runners on the way back up. Not only that, but you can buy now and stake your HEX and receive interest paid in more HEX while we wait for a bottom. I would be lying if I said I haven't tested the stake theory. I now how have a ladder stake for the next 10 years.

HEX USDCMy setup on HEX USDC
UNISWAP:HEXUSDC
OPEN: 0.03175
TP1: 0.04062
TP2: 0.05545
TP3 : 0.09911
SL: 0.02943
How you this about this ?

HEX weekly chart is still intact and waiting for PLS launchHEX WEEKLY CHART:
upon waiting for the PLS (PULSECHAIN) launch
we have been in a huge downtrend...Once we
here from Richard Hearts new Project PLS launch date,
is when this chart will turn bullish. Thats the
truth...The long rectangle support box must hold
or this chart will need a Scuba Suit. RSI IS WAY
OVERSOLD!

HEX ,it was good fun The 0.768 fibo retracement @.102c was good support for a while.
Next target should be 0.0135c (intermediate target,probably in the next two months) with full support anywhere between 0.0023-0.008c in the next comming 6-8 months.
Target1 : 0.013c
Target2: 0.008c

#HEX still under control of the BEARS!From the inverse HVF funnel formation and break.
HEX dropped below 3 cents
A return move to the initial funnel range , seems to be a relief rally.
If #Bitcoin does continue on below $15,000 and under
The projection of HEX to reach a penny for a capitulatory, cycle bottom still exists.
This I believe will set up for a fantastic reflation period of #crypto going into 2023 and the next cycle top in 2025.
A few more months of pain , but the rewards for sticking around, and being patient will reward some of us. Not everyone can make it despite the great design mechanics of HEX , this is still highly speculative and the volatility wears on even the strong minded.
Survive to Thrive!

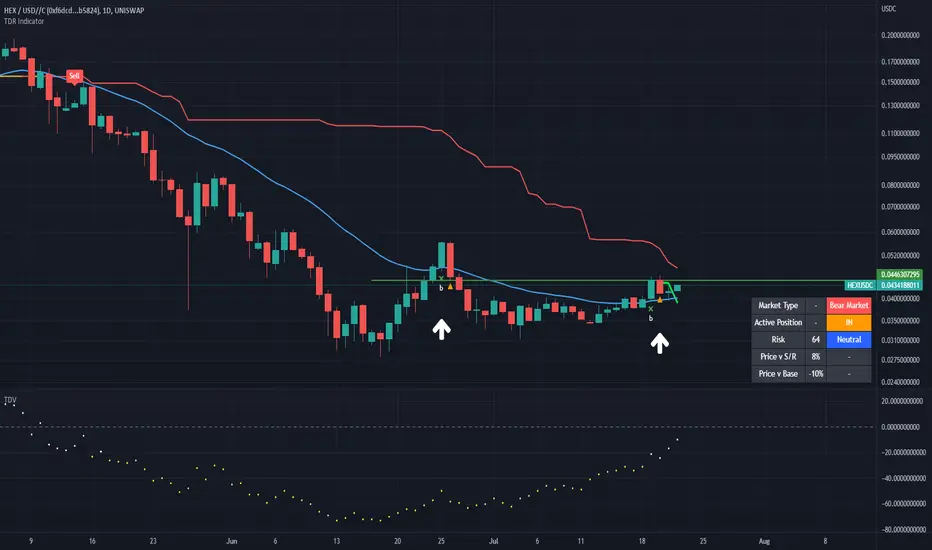
DCA buy signal on HEXUSDCHex is down -65% from the previous sell signal at around $0.13 and after falling around -73% from that signal we have just got a confirmation on an entry with a DCA buy. With the base at $0.10 and the TDV indicator at -54% and the risk in a neutral position, this is a good area to start opening a position on HEX. The previous breakout failed at $0.13 and now is a good opportunity to establish a new position at a much lower price, see the related ideas linked below.

Hex, 100x from here??!Im happy with the zone its coming from but theres no monthly demand it could go down but it almost hit the last box in the bottom. Hex could see 100x from here!. price is already cheap enough !.

Hex 100% is real easy. Up Up to the sky, fly robin fly.
There is a clear and defined path to .14c
HEX/PLS is ready to fill the vacuum created by conmen and thieves.
We could form an inverted head and shoulder around 6?
Let re-evaluate the momentum as we approach 12c-14c

HEX Historical CorrectionsHEX is experiencing it's largest correction in it's history.
Historically speaking, about 85% was it's largest correction before. But, as we know, cryptos can dip 99%!
This could happen.

HEX weekly chart is still intact and waiting for PLS launchHEX WEEKLY CHART:
upon waiting for the PLS (PULSECHAIN) launch
we have been in a huge downtrend...Once we
here from Richard Hearts new Project PLS launch date,
is when this chart will turn bullish. Thats the
truth...The long rectangle support box must hold
or this chart will need a Scuba Suit. RSI IS WAY
OVERSOLD!

HEX weekly is still holding major supportHEX WEEKLY CHART:
upon waiting for the PLS (PULSECHAIN) launch
we have been in a huge downtrend...Once we
here from Richard Hearts new Project PLS launch date,
is when this chart will turn bullish. Thats the
truth...The long rectangle support box must hold
or this chart will need a Scuba Suit. RSI IS WAY
OVERSOLD!

HEX WEEKLY CHART. Support must hold or swimming beginsHEX WEEKLY CHART:
upon waiting for the PLS (PULSECHAIN) launch
we have been in a huge downtrend...Once we
here from Richard Hearts new Project PLS launch date,
is when this chart will turn bullish. Thats the
truth...The long rectangle support box must hold
or this chart will need a Scuba Suit. RSI IS WAY
OVERSOLD!

#HEX Target 2 Met!Target 3 is obviously a long way down from here.
mentally prep if you have long term stakes.
