HIFIUSDT Forming Falling WedgeHIFIUSDT is currently displaying a classic falling wedge pattern, a powerful bullish technical setup that often precedes a major trend reversal. This pattern forms as price compresses within converging trendlines, indicating declining volatility and seller exhaustion. Falling wedges are known for their high breakout success rate, and the current structure on HIFIUSDT is pointing toward a potential explosive upside move once resistance is broken.
The volume profile also supports the bullish case. There has been a noticeable increase in buy-side activity around key support zones, reflecting renewed investor confidence and accumulation at lower levels. When paired with a falling wedge, this kind of volume behavior often marks the beginning of a strong upward rally. Traders and investors anticipating a breakout could potentially see a remarkable 490% to 500%+ gain if the momentum continues to build.
The market interest in HIFI is growing rapidly, with increased mentions across trading communities and social platforms. The fundamentals of the project, combined with this bullish technical setup, are attracting both short-term speculators and long-term holders. The current structure also aligns with historical breakout patterns seen in similar altcoins before major bull runs, making it a compelling chart to watch closely.
For technical traders, a confirmed breakout with above-average volume from the wedge resistance will likely trigger a wave of buying pressure. Managing entries on breakout retests and using proper stop levels will be key to navigating this setup with discipline.
✅ Show your support by hitting the like button and
✅ Leaving a comment below! (What is You opinion about this Coin)
Your feedback and engagement keep me inspired to share more insightful market analysis with you!
HIFIUSDT trade ideas

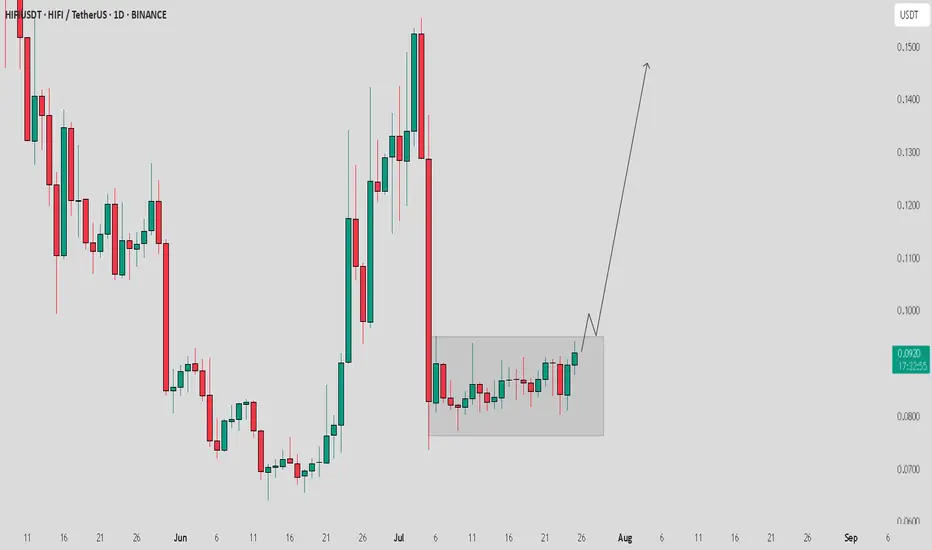
HIFI / USDT in consolidation zone heading to break through itHIFI/USDT Analysis:
HIFI/USDT is currently in a consolidation zone and seems to be heading towards a potential breakout. If it breaks through this zone, we could see a good move towards $0.14 soon, assuming the market remains stable.
Bullish Scenario:
Breakout above consolidation zone could trigger a strong move towards $0.14.
Confirmation: Watch for strong volume during the breakout to ensure the move is genuine.
Bearish Scenario:
Failure to Breakout: If the price fails to break through and stays within the consolidation, the setup might remain invalid.
Note:
Current market situation is not looking very strong right now. I hope the correction happens smoothly soon, but if the market remains unstable, this setup could become invalid. Always manage your risk and stay cautious.
HIFIUSDT Forming Falling Wedge HIFIUSDT is forming a textbook falling wedge pattern on the chart, a classic bullish reversal signal that often precedes strong upside movement. This pattern occurs when price action consolidates between two downward sloping trendlines, gradually tightening before a breakout to the upside. The current structure on HIFIUSDT suggests that the selling pressure is losing momentum, and a breakout could trigger an explosive bullish run. With technical confirmation building and a tightening wedge structure, traders and investors alike are starting to take serious interest in this setup.
Volume analysis further supports the bullish bias. Despite the decline in price, volume has remained relatively stable, a sign that the coin is being quietly accumulated. This kind of price-volume divergence typically precedes major market moves. As the wedge approaches its apex, a breakout with strong volume could ignite a significant price surge. Given the historical price action and chart projections, HIFIUSDT has the potential to deliver an extraordinary 490% to 500% gain from current levels, making it one of the most promising technical plays in the market right now.
Market sentiment around the HIFI ecosystem is also improving, with increased social media engagement, partnerships, and on-chain activity. This suggests that both speculative traders and long-term holders are watching the project closely. As the broader crypto market leans bullish, coins with strong technical setups like HIFIUSDT are well-positioned to outperform.
With its current technical structure, strong community interest, and substantial upside potential, HIFIUSDT presents a rare opportunity for traders looking for high-reward breakout trades. Watch closely for a confirmed breakout from the wedge—this could be the signal that a major rally is beginning.
✅ Show your support by hitting the like button and
✅ Leaving a comment below! (What is You opinion about this Coin)
Your feedback and engagement keep me inspired to share more insightful market analysis with you!

HIFI/USDT (CryptoNation_369)The trendline break, combined with sideways consolidation and a breakout candle, could be considered a bullish reversal pattern.
The volume confirmation (not shown here) would be useful to further validate the breakout strength.
Stop-loss is placed just below a local support zone, which is a common and logical choice.

HIFI | Long | Fixed-Rate Lending Narrative| (May 22, 2025)HIFI | Long | Fixed-Rate Lending Narrative + Swing Setup Forming | (May 22, 2025)
1️⃣ Quick Take: HIFI is showing strong upside potential, with open interest rising and a key liquidity zone approaching. This is a swing trade idea targeting a breakout above recent structure levels.
2️⃣ Trade Parameters:
Bias: Long
Entry: Current market price (~$0.0932), just below last week’s key level
Stop Loss: Below $0.0932 support
TP1: $0.155 (Partial Exit – liquidity cluster zone)
TP2: $0.1855
TP3: $0.4342 (Swing Target)
📈 If we approach $0.155, expect possible liquidations that may cause a short squeeze—watch closely for volatility around that area.
3️⃣ Key Notes:
HIFI is riding the momentum of the fixed-rate, fixed-term lending narrative in DeFi. Its bond-like, tokenized debt instruments bring stability in an otherwise volatile market.
Built on Ethereum, HIFI targets a niche yet valuable DeFi segment—predictable borrowing.
Open interest and volume are starting to pick up, indicating early accumulation.
Liquidity at $0.155 makes it a tactical TP1, while the broader target at $0.4342 hinges on continued trend and macro sentiment.
4️⃣ Follow-up: This is a swing setup, so I’ll monitor and adjust based on how price behaves near the liquidation zone and trend continuation structure.
Please LIKE 👍, FOLLOW ✅, SHARE 🙌 and COMMENT ✍ if you enjoy this idea! Also share your ideas and charts in the comments section below! This is best way to keep it relevant, support us, keep the content here free and allow the idea to reach as many people as possible.
Disclaimer: This is not a financial advise. Always conduct your own research. This content may include enhancements made using AI.

$HIFI/USDT Breakout Confirmation:$HIFI/USDT Breakout Confirmation:
Price has broken the descending trendline and is holding above key structure, showing early bullish signs.
🔸 Key Support Zone at 0.123:
This zone has acted as strong support with visible buyer interest. A solid base for potential upward movement.
🔸 Upside Target: 0.1450 – 0.1650
Price may retest previous resistance levels if bullish momentum continues.
🔸 Risk Level at 0.1100:
A break below this invalidates the breakout and indicates weakness.
#LTO #PORTAL #ANIME #KMNO #BB #HMSTR #FIDA #DOGS #SXT #STPT #NXPC #AMP #CVC #PSG #SYRUP #FTT #FXS #PEOPLE #NEIRO #EPIC

$HIFI - We are at the end of RegressionBINANCE:HIFIUSDT - We are almost at the end of a regression trend. This is probably the last chance to get into this and at this price, before it blows up. All the best !

HIFI looks to be coming out of a double bottomEvery other crypto out there has had a mini bull-run over the past few days except for HIFI which has seen a small dump. STOCH RSI is in oversold territory on the daily and the 4 hour. This looks like it could shape in to a classic W shaped double bottom reversal.

Forming Potential Cup and Handle Pattern🚨 $HIFI
Forming Potential Cup and Handle Pattern 🚨
$HIFI
is forming a potential cup and handle pattern. For this bullish pattern to be confirmed, the price needs to break out above the red resistance zone.
📈 Technical Overview:
Pattern: Potential Cup and Handle
Resistance Zone: Red area currently being tested.

HIFI/USDTKey Level Zone : 0.6160 - 0.6210
HMT v4.1 detected. The setup looks promising, supported by a previous upward/downward trend with increasing volume and momentum, presenting an excellent reward-to-risk opportunity.
HMT (High Momentum Trending):
HMT is based on trend, momentum, volume, and market structure across multiple timeframes. It highlights setups with strong potential for upward movement and higher rewards.
Whenever I spot a signal for my own trading, I’ll share it. Please note that conducting a comprehensive analysis on a single timeframe chart can be quite challenging and sometimes confusing. I appreciate your understanding of the effort involved.
Important Note :
Role of Key Levels:
- These zones are critical for analyzing price trends. If the key level zone holds, the price may continue trending in the expected direction. However, momentum may increase or decrease based on subsequent patterns.
- Breakouts: If the key level zone breaks, it signals a stop-out. For reversal traders, this presents an opportunity to consider switching direction, as the price often retests these zones, which may act as strong support-turned-resistance (or vice versa).
My Trading Rules
Risk Management
- Maximum risk per trade: 2.5%.
- Leverage: 5x.
Exit Strategy
Profit-Taking:
- Sell at least 70% on the 3rd wave up (LTF Wave 5).
- Typically, sell 50% during a high-volume spike.
- Adjust stop-loss to breakeven once the trade achieves a 1.5:1 reward-to-risk ratio.
- If the market shows signs of losing momentum or divergence, ill will exit at breakeven.
The market is highly dynamic and constantly changing. HMT signals and target profit (TP) levels are based on the current price and movement, but market conditions can shift instantly, so it is crucial to remain adaptable and follow the market's movement.
If you find this signal/analysis meaningful, kindly like and share it.
Thank you for your support~
Sharing this with love!
HMT v2.0:
- Major update to the Momentum indicator
- Reduced false signals from inaccurate momentum detection
- New screener with improved accuracy and fewer signals
HMT v3.0:
- Added liquidity factor to enhance trend continuation
- Improved potential for momentum-based plays
- Increased winning probability by reducing entries during peaks
HMT v3.1:
- Enhanced entry confirmation for improved reward-to-risk ratios
HMT v4.0:
- Incorporated buying and selling pressure in lower timeframes to enhance the probability of trending moves while optimizing entry timing and scaling
HMT v4.1:
- Enhanced take-profit (TP) target by incorporating market structure analysis


HIFIUSDT Buy opportunityHIFIUSDT has confirmed an ascending triangle breakout, signaling strong bullish momentum. Our plan involves entering a long position on a pullback into the identified buy zone, ensuring the stop-loss is positioned below the most recent swing low to manage risk effectively.
The profit target for this setup is aligned with the supply zone highlighted on the chart, marking a key area for potential price reversal or profit-taking.
Share your thoughts and analysis on this coin with us!

#HIFI : An accumulation of 4 months BREAKING OUT !!! BINANCE:HIFIUSDT
#HIFI : An accumulation of 4 months BREAKING OUT !!!

Buy Trade Strategy for HiFi: Capitalizing on DeFi Lending InnovaDescrizione:
This trading idea focuses on HiFi (formerly known as Mainframe), a cryptocurrency that plays a critical role in decentralized finance (DeFi) lending. HiFi is designed to enable fixed-rate, fixed-term lending, which sets it apart from other DeFi projects in an industry typically dominated by variable-rate solutions. With its innovative approach to lending and borrowing on the blockchain, HiFi has gained traction as an appealing option for investors who seek exposure to the growing DeFi ecosystem. HiFi's fundamentals, such as increasing adoption, solid tokenomics, and strategic partnerships, contribute to its long-term potential.
That said, cryptocurrency markets are notoriously volatile, and external factors like regulatory shifts, economic events, and technological advancements can lead to sharp price movements. As always, trading in assets like HiFi requires a solid risk management strategy.
Disclaimer:
This trading idea is provided for educational purposes only and should not be considered financial advice. Cryptocurrencies are highly speculative and carry a significant level of risk, including the possibility of losing your entire investment. Always conduct your own research, carefully evaluate your financial situation, and consult with a professional advisor before making any investment decisions. Past performance is not indicative of future results.

HIFIUSDT Strong Bullish!HIFIUSDT technical analysis update
HIFI's price is breaking resistance after a 100-day range-bound market, and it is currently trading above the 100 EMA on the daily chart. This can be considered a bullish signal for HIFI.

HIFI ANALYSIS (4H)From where we put the green arrow on the chart, it looks like a triangle is forming on the chart.
It seems that we are now in wave D of this triangle.
The E wave can start from the green range.
We are looking for buy/long positions in the green range.
Closing a daily candle below the invaliation level will violate the analysis.
For risk management, please don't forget stop loss and capital management
When we reach the first target, save some profit and then change the stop to entry
Comment if you have any questions
Thank You

HIFIUSDT.PHIFIUSDT.P is in bullish trend.
Potentially printing HH and HL.
Bullish continuation flag also form.
No sign of reversal here.
We wait and watch for the breakout of flag pole.

HIFI/USDT DAILY ANALYSIS Price broke and closed above Saturday's daily Candlestick and now it is coming back to retest that high,and most likely reverse to the upside.

HIFI ANALYSIS#HIFI Analysis : Channel Breakdown
📊As we can see that #HIFI was following ascending channel on 4hr time frame. But we can see a breakdown and 2 times retest the same channel. Right now there is a major support level at 0.4855 and if #HIFI breakdown that level then we would see a dump otherwise it will take reversal from its major support zone.
⁉️ What to do?
- Keep your eyes on the chart, observe trading volume and stay accustom to market moves.🚀💸
#DYOR #CRYPTOCURRENCY

HIFIUSDTWe can attempt to buy HIFIUSDT from specified level as it break LH , also bullish divergence occur indicate that it moves upward.
SL , TP mention in chart.

HIFIUSDT.PHIFIUSDT.P is in bullish trend.
POtentially printing HH and HL.
No sign of reversal we wait and watch for the breakout of last HH.

$HIFIShort position with stop loss at $0.4788
Please DYOR before take a position.
Always use stop loss and manage your own risk!!

Hifi BINANCE:HIFIUSDT
Price : Buy some right Ad always use stop loss market is volatile
Trade Care any coin positions
CPI Data Is Coming After an Hour, Volatility Will Be High😬
After The Previous CPI Data The Market Dumped Very Hard📉(Anything Could Happen Today)
Must Use Stop Loss On Your Trades And If You Are In Profit In Any Trade Then Move Stop Loss To Entry
Disclaimer : I am not Financial Advisor
