Solid bull momentumrecent test on daily supply line , and if this can consolidate nicely, it may present buy opportunity.
HIGHUSDT trade ideas

HIGHUSDT Analysis D1HIGHUSDT Already Broken Descending Broadening and started Recovery in D1 Chart
Continuity of momentum can see 80-120% Bullish Rally in Short-term .


HIGHUSDT | +1800% Daily Volume Spike – Major Move Loading?Today, HIGHUSDT is one of the most explosive coins on the market, with an insane 1800% volume spike—this kind of surge never goes unnoticed. When a coin pulls this much liquidity in a single day, it's a clear sign that a major move is coming, and smart traders start watching it like a hawk.
🔍 What I'm Watching:
📈 Scenario 1 – Long Opportunity:
If HIGH breaks out of its current range with strength, ideally with confirmation from LTF breakout structures and sustained volume, I’ll be looking for a potential long setup targeting the next major resistance zone. This move could be fast and aggressive, so reactivity and confirmation are key.
🔻 Scenario 2 – Short Opportunity:
However, if we approach the resistance zone and sellers begin stepping in (especially if CDV divergence or delta weakness shows up), this could give us an ideal short setup. I’ll only consider it with strong LTF confirmations.
📌 Why You Should Care:
I only analyze coins that rank at the top in volume increase, this is how we isolate the setups with the most eyes and liquidity. And if you've been following my setups, you already know: timing and confirmation are everything.
🔥 Stay close. HIGH is about to make a serious decision,and when it does, we’ll be ready to capitalize.
📌I keep my charts clean and simple because I believe clarity leads to better decisions.
📌My approach is built on years of experience and a solid track record. I don’t claim to know it all but I’m confident in my ability to spot high-probability setups.
📌If you would like to learn how to use the heatmap, cumulative volume delta and volume footprint techniques that I use below to determine very accurate demand regions, you can send me a private message. I help anyone who wants it completely free of charge.
🔑I have a long list of my proven technique below:
🎯 ZENUSDT.P: Patience & Profitability | %230 Reaction from the Sniper Entry
🐶 DOGEUSDT.P: Next Move
🎨 RENDERUSDT.P: Opportunity of the Month
💎 ETHUSDT.P: Where to Retrace
🟢 BNBUSDT.P: Potential Surge
📊 BTC Dominance: Reaction Zone
🌊 WAVESUSDT.P: Demand Zone Potential
🟣 UNIUSDT.P: Long-Term Trade
🔵 XRPUSDT.P: Entry Zones
🔗 LINKUSDT.P: Follow The River
📈 BTCUSDT.P: Two Key Demand Zones
🟩 POLUSDT: Bullish Momentum
🌟 PENDLEUSDT.P: Where Opportunity Meets Precision
🔥 BTCUSDT.P: Liquidation of Highly Leveraged Longs
🌊 SOLUSDT.P: SOL's Dip - Your Opportunity
🐸 1000PEPEUSDT.P: Prime Bounce Zone Unlocked
🚀 ETHUSDT.P: Set to Explode - Don't Miss This Game Changer
🤖 IQUSDT: Smart Plan
⚡️ PONDUSDT: A Trade Not Taken Is Better Than a Losing One
💼 STMXUSDT: 2 Buying Areas
🐢 TURBOUSDT: Buy Zones and Buyer Presence
🌍 ICPUSDT.P: Massive Upside Potential | Check the Trade Update For Seeing Results
🟠 IDEXUSDT: Spot Buy Area | %26 Profit if You Trade with MSB
📌 USUALUSDT: Buyers Are Active + %70 Profit in Total
🌟 FORTHUSDT: Sniper Entry +%26 Reaction
🐳 QKCUSDT: Sniper Entry +%57 Reaction
📊 BTC.D: Retest of Key Area Highly Likely
📊 XNOUSDT %80 Reaction with a Simple Blue Box!
📊 BELUSDT Amazing %120 Reaction!
I stopped adding to the list because it's kinda tiring to add 5-10 charts in every move but you can check my profile and see that it goes on..
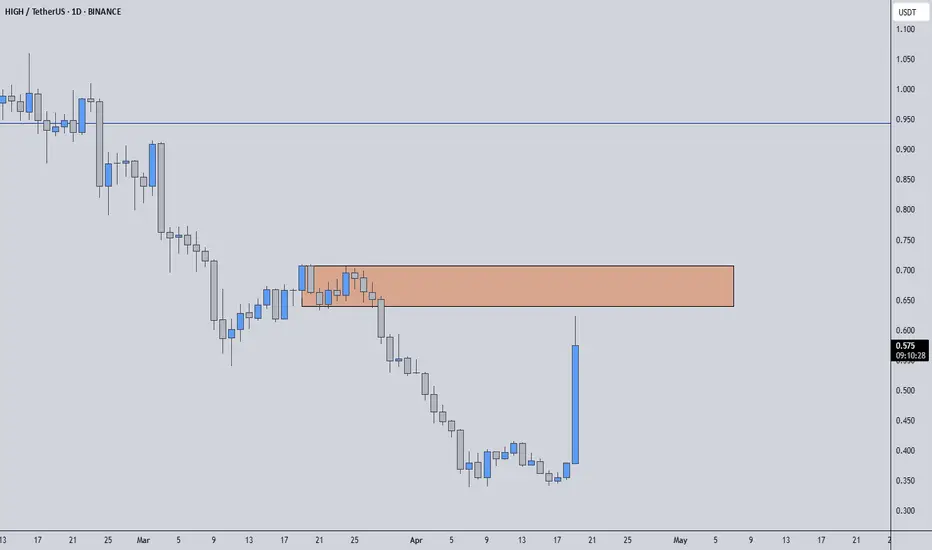
A candle above the channel is neededHigh is about to break the channel, which was stuck in for about 4 and half months. If it closes the candle above the channel, we may see more pump toward ~$0.74, ~$1.05, ~$1.57 in a 5-wave move. But due to the bearish RSI divergence, it may continue to fluctuate downward in the channel and test the support again.

HIGHUSDT is making HH and HL As per DOw analysis HIGH usdt is in bullish phase and can increase in future
TP: :0.9

LongDue to the deep correction and the collision with the downtrend lines, I expect an upward movement. Please trade spot because this altcoin has a lot of volatility.

HIGHUSDT 1DHIGH ~ 1D Analysis
#HIGH This coin is still in the channel decreases, waiting for this resistant line successfully penetrated. Maybe with a minimum target of 10%+.

HIGH/USDTKey Level Zone: 0.8650 - 0.8700
HMT v6 detected. The setup looks promising, supported by a previous upward/downward trend with increasing volume and momentum, presenting an excellent reward-to-risk opportunity.
HMT (High Momentum Trending):
HMT is based on trend, momentum, volume, and market structure across multiple timeframes. It highlights setups with strong potential for upward movement and higher rewards.
Whenever I spot a signal for my own trading, I’ll share it. Please note that conducting a comprehensive analysis on a single timeframe chart can be quite challenging and sometimes confusing. I appreciate your understanding of the effort involved.
Important Note :
Role of Key Levels:
- These zones are critical for analyzing price trends. If the key level zone holds, the price may continue trending in the expected direction. However, momentum may increase or decrease based on subsequent patterns.
- Breakouts: If the key level zone breaks, it signals a stop-out. For reversal traders, this presents an opportunity to consider switching direction, as the price often retests these zones, which may act as strong support-turned-resistance (or vice versa).
My Trading Rules
Risk Management
- Maximum risk per trade: 2.5%.
- Leverage: 5x.
Exit Strategy
Profit-Taking:
- Sell at least 70% on the 3rd wave up (LTF Wave 5).
- Typically, sell 50% during a high-volume spike.
- Adjust stop-loss to breakeven once the trade achieves a 1.5:1 reward-to-risk ratio.
- If the market shows signs of losing momentum or divergence, ill will exit at breakeven.
The market is highly dynamic and constantly changing. HMT signals and target profit (TP) levels are based on the current price and movement, but market conditions can shift instantly, so it is crucial to remain adaptable and follow the market's movement.
If you find this signal/analysis meaningful, kindly like and share it.
Thank you for your support~
Sharing this with love!
HMT v2.0:
- Major update to the Momentum indicator
- Reduced false signals from inaccurate momentum detection
- New screener with improved accuracy and fewer signals
HMT v3.0:
- Added liquidity factor to enhance trend continuation
- Improved potential for momentum-based plays
- Increased winning probability by reducing entries during peaks
HMT v3.1:
- Enhanced entry confirmation for improved reward-to-risk ratios
HMT v4.0:
- Incorporated buying and selling pressure in lower timeframes to enhance the probability of trending moves while optimizing entry timing and scaling
HMT v4.1:
- Enhanced take-profit (TP) target by incorporating market structure analysis
HMT v5 :
Date: 23/01/2025
- Refined wave analysis for trending conditions
- Incorporated lower timeframe (LTF) momentum to strengthen trend reliability
- Re-aligned and re-balanced entry conditions for improved accuracy
HMT v6 :
Date : 15/02/2025
- Integrated strong accumulation activity into in-depth wave analysis

HIGHUSDT SELL
hi another idea .this is HIGHUSDT and I am selling it for short term and then i will buy it from the lowest point in spot trading.
watch the following steps
1.Risk management
2. take trades with stop loss
3. Trade according to your account balance

HIGHUSDT 1WHIGH ~ 1W
#HIGH If you still have Conviction on this coin,. This support block would be a very good buying place for now,. buy in stages with a target of 20%++

#HIGH (SPOT) IN ( 1.100- 1.400) T.(7.000) SL(1.051)BINANCE:HIGHUSDT
#HIGH / USDT
Entry ( 1.100- 1.400)
SL 1D close below 1.051
T1 2.200
T2 2.600
T3 3.300
T4 4.000
T5 5.000
T6 5.800
T6 7.000
______________________________________________________________
Golden Advices.
********************
* collect the coin slowly in the entry range.
* Please calculate your losses before the entry.
* Do not enter any trade you find it not suitable for you.
* No FOMO - No Rush , it is a long journey.
Useful Tags.
****************
My total posts
www.tradingview.com
**********************************************************************************************
#Manta #OMNI #DYM #AI #IO #XAI #ACE #NFP #RAD #WLD #ORDI #BLUR #SUI #VOXEL #AEVO #VITE #APE #RDNT #FLUX #NMR #VANRY #TRB #HBAR #DGB #XEC #ERN #ALT #IO #ACA #HIVE #ASTR #ARDR #PIXEL #LTO #AERGO #SCRT #ATA #HOOK #FLOW #KSM #HFT #MINA #DATA #SC #JOE #RDNT #IQ #CFX #BICO #CTSI #KMD #FXS #DEGO #FORTH #AST #PORTAL #CYBER #RIF #ENJ #ZIL #APT #GALA #STEEM #ONE #LINK #NTRN #COTI #RENDER #ICX #IMX #ALICE #PYR #PORTAL #GRT #GMT #IDEX #NEAR #ICP #ETH #QTUM #VET #QNT #API3 #BURGER #MOVR #SKL #BAND #ETHFI #SAND #IOTX #T #GTC #PDA #GMX #REZ #DUSK #BNX #SPELL #POWR #JOE #TIA #TFUEL #HOT #AVAX #WAXP #OGN #AXS #GALA #ONE #SYS #SCRT #DGB #LIT #QI #FIL #GLMR #ATOM #LTC #MANA #ONT #TLM #SLP

#HIGH (SPOT) entry range( 1.080- 1.380) T.(3.990) SL(0.944)BINANCE:HIGHUSDT
entry range (1.080- 1.380)
Target1 (1.910) - Target2 (2.612) - Target3 (3.249) - Target4 (3.990)
3 Extra Targets(optional) in chart, if you like to continue in the trade with making stoploss very high.
SL .1D close below (0.944)
*** collect the coin slowly in the entry range ***
*** No FOMO - No Rush , it is a long journey ***
**** #Manta ,#OMNI, #DYM, #AI, #IO, #XAI , #ACE #NFP #RAD #WLD #ORDI #BLUR #SUI #Voxel #AEVO #VITE #APE #RDNT #FLUX #NMR #VANRY #TRB #HBAR #DGB #XEC #ERN #ALT #IO #ACA #HIVE #ASTR #ARDR #PIXEL #LTO #AERGO #SCRT #ATA #HOOK #FLOW #KSM #HFT #MINA #DATA #SC #JOE #RDNT #IQ #CFX #HIGH ****

$HIGH for Christmas#high analysed with past price action
In the past, high has consolidated before it expanded
And it always act like the wave 3 is about to begin, look what happened in the past when the wave 3 began

<HIGH> FOR BUY!!!Hello friends
This coin has succeeded in turning the trend due to the good flooring it has done.
Now considering that the price is a good place, it increases the value of buying it.
If you like it, we will be happy to support us with likes and comments.

Can #High Bulls Sustain Current Bullish Momentum? Key Levels Yello, Paradisers! Is #HIGH gearing up for a massive breakout, or could we see a bearish trap unfold? Let’s uncover what’s next for #HIGHUSDT:
💎The breakout of #HighStreet from the descending channel formation marks a significant turning point. After months of being trapped in a bearish structure, the breakout above the descending resistance line signals a potential trend reversal. However, the $2.547 level now acts as a major resistance zone. A decisive close above this level is crucial for confirming bullish momentum and opening the path toward the next resistance target near $4.50–$5.00.
💎If buyers manage to take control and break through the $2.547 barrier, we could see an explosive rally into the $4.50-$5.00 resistance zone, aligning with the key levels of previous price action. This move would confirm the bulls are back in charge and could even set the stage for a larger bullish structure in 2025.
💎On the flip side, the $1.600 support level and $1.266 demand zone are critical areas to watch for potential bearish invalidation. A daily candle close below $1.266 would signal a breakdown of the bullish structure, likely driving the price back into the descending channel. This could trigger further selling pressure, pushing the market toward the $0.94 region or lower.
Stay focused, patient, and disciplined, Paradisers🥂
MyCryptoParadise
iFeel the success🌴

HIGH - Getting READY ?!Highstreet it's looking undervalued and its know for going very HIGH :)
We can see on smaller time frames it recovered fast today from the "lows"
Some targets are on this chart - blue target its an older resistance

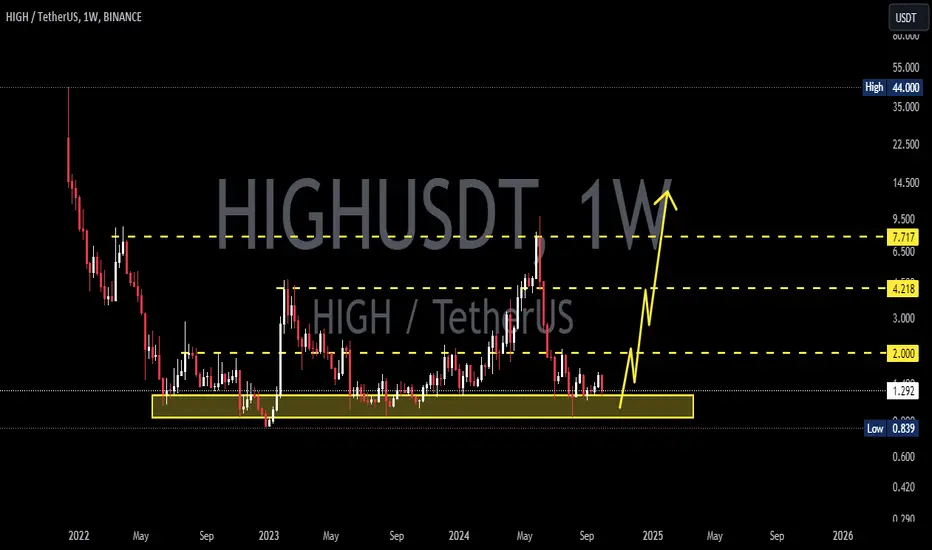
Highstreet: $70 In A Close-Distant Future (Trading Strategy 101)In the year 2025. In a very close-distant future, HIGHUSDT (Highstreet) will trade at a price of $70.
Good morning my fellow Cryptocurrency trader, I hope you are having a wonderful weekend.
Highstreet is moving within a long-term accumulation channel, almost reaching the upper-boundary of this trading range. This channel has been active since May 2022 and is about to break.
The about to break prediction is easy to make. We just need to look at marketwide action, considering the Altcoins that are ahead. Those that moved first and trading really strong. Some of this are now at multi-year high, while others are hitting new All-Time Highs.
Trading Strategy 101 Simplified
➖ Buy and hold. We look for a pair that is good based on technical analysis and the market cycle and we buy and hold.
➖ Set your sell order on target. We have multiple levels on this chart. Right after buying, we have to set our sell orders. Say, 10% at 4.39, 20% at 10 (for 300%), 30% at 25 and 40% at 40. This is just one example.
➖ Collect profits. That is all. First we buy and then we hold. We can set up an alarm for when the pair moves or we can simply track it in whatever way that works for us. But this the best strategy ever because after you set it, you forget it; there is no stress nor anxiety involved.
➖ Summary: First we buy. Then we set the sell orders on target and hold. When the targets hit, we collect the profits and move on.
Trading Strategy 102 —Expanded
In order to reduce risk and maximize potential gains, we divide our capital into multiple trades. Rather than putting 100% into one pair/trade, we can do 20% into five pairs, or 10% into ten trades.
What you do will depend on your own trading style. What is your risk tolerance? How big is your capital? Are you trading daily, weekly, yearly or monthly? Would you like to see results after a few months or are you ready to wait several years?
These questions will define which strategy you use.
We have many different strategies because there are many of us.
We have to do our part... I do the charts and the numbers, I share the lessons, but you have to set it up based on your goals.
You are responsible for your own actions, we are all adults.
Not all trades can be won; and that's ok.
Some we lose. From the losing ones we make lessons out of our mistakes.
With these lessons we improve our game and do better next time.
There is no way to fail because the market offers endless opportunities.
If something goes wrong today, we can try again tomorrow and after-tomorrow and forevermore. There is no limit as to how many times you can keep on trying until you achieve your goals.
If you accept responsibility for your actions, you can improve every single day.
If you blame others for your mistakes, you can't never get ahead.
There are no successful traders ever who become the best by blaming others when something goes wrong.
We are happy when we win.
We are strong when we take a loss.
There is no time to cry.
Stand up and grow.
The time to take action is now.
We are reaching the end of 2024.
We are entering the strongest bull-market in the history of Cryptocurrency.
We know what is going to happen, we know how high prices will go.
Knowing this, how will you make the most of this information?
What would you do now, if you knew that the entire market is about to go up?
How would you position yourself to achieve your financial goals?
The simplest way is to buy and hold, but this can be expanded and improved.
The choice is yours.
Thanks a lot for your continued support.
Namaste.

#HIGH On the Edge of a Major Breakout From Descending ChannelYello! 👀 Is #HIGHUSDT on the edge of a major breakout, or are we setting up for another fakeout? Let's see the latest analysis of #HighStreet:
💎After 4-5 months of a sharp downtrend, #HIGH is finally approaching a critical moment. It’s testing the upper boundary of a Descending Channel, fueled by a strong Bullish Order Block (OB) around $1.177. While this might look like the turning point we've been waiting for, don't get too comfortable just yet.
💎To truly ignite this rally, #HighStreet needs to overcome a significant hurdle—the Bearish OB between $1.55 and $1.65, which previously served as a strong support level. A breakout above this zone, coupled with increasing volume and confirmation from the 20 EMA, could signal that the bulls are ready to take over. If that happens, expect a push toward the next major resistance.
💎However, if momentum slows down, we could see a pullback toward $1.177, retesting the breakout zone. A failure to hold this level might signal trouble, potentially dragging HIGH back down to the $0.95-$1.03 demand zone.
💎And here’s the real risk—if it breaks below this major support, it would hand control back to the bears, opening the door for a deeper correction and likely crushing hopes of a short-term bullish recovery.
Stay focused, patient, and disciplined, Paradisers🥂
MyCryptoParadise
iFeel the success🌴

#HIGHUSDT (11-2024) Watchlist🚨 HIGH/USD Analysis 🚨
🔹 Current Price: $1.347
🔹 Support: $1 (Panic Level)
🔹 Key Resistance: $2.2
Pattern: Descending Triangle ⏳
HIGH has been moving between $1 and $1.5 for the past 100 days, holding strong above historical support at $1. This consolidation within a descending triangle suggests that the price is primed for a potential breakout.
Bullish Scenario:
If HIGH breaks above $1.5, we could see a bullish wave with targets at:
📈 $2.2
🚀 $2.6
🎯 $3.8
Bearish Scenario:
If HIGH falls below $1, consider it a warning sign for further downside risk.
📌 Trade Tip: Keep a close eye on the $1.5 resistance level for confirmation of a bullish breakout. Above this level, the potential for upward momentum increases significantly. However, if it drops below $1, it might be best to reassess the position.
Note:
This is not financial advice but an analysis of coin movements. Conduct your own research and practice risk management before making any investment decisions. Remember, the cryptocurrency market carries significant volatility and risks.
Best wishes to all,
we ask Allah reconcile and repay. 🙏

HIGHUSDT Trading Signal AlertAttention Traders,
We have identified a potential opportunity in the HIGHUSDT trading pair based on our proprietary EASY Quantum Ai strategy. The following trading parameters have been formulated to ensure optimal entry and exit points:
- Direction: Buy
- Enter Price: 1.408
- Take Profit: 1.437
- Stop Loss: 1.352
Our EASY Quantum Ai strategy suggests a bullish trend for HIGHUSDT. Several key factors have influenced this forecast:
1. Market Momentum: Current momentum indicators suggest an upward trend, with bullish market sentiment strengthening the pair's potential growth.
2. Technical Indicators: The moving averages signal a crossover in the positive direction, aligning with our buy signal. Additionally, RSI values indicate that the asset is not yet overbought, leaving room for further gains.
3. Economic Factors: Positive macroeconomic data and favorable market conditions in the cryptocurrency sector provide a supportive backdrop for HIGHUSDT's potential appreciation.
We advise traders to enter at the specified price of 1.408, with a target take profit at 1.437. To manage risk, set your stop loss at 1.352. Always consider your risk tolerance and trading objectives before entering any position.
Happy Trading!

HIGHUSDTHIGH ~ 1W
#HIGH If you have Conviction on this coin,. Maybe this support Block will be a very good buy for now. at least for 20%++ profit
Highstreet (HIGH) - Easiest long trade.. ..since long trades were invented. Basically it is free money.
On above 3-day chart price action has corrected 80% since 20 days ago! Market participants have capitulated. Take advantage.
Previously price action has corrected to confirm support on past resistance. Sure it will break if it is meant to this time, but not right now. That is what makes this an easy trade. Look left.
The previous two support confirmations resulted in bounces of 50% and 100% (growing), respectively. On this bounce sellers are absent, which will make for a stronger support confirmation than the previous two.
How can I be so sure? Experience laddie and ladets.
Zooming in down to the 18hr chart we can see all oscillators are now recording bullish divergence (black circles). Divergencies that were just as strong when the market was bearish. This time on the reversal.
Is it possible price action correction further? Sure.
Is it probable? No.
Ww
18hr
