HIVEBTC: Highest Volume Since Early 2023After producing a major bottom shakeout, a liquidity hunt event, HIVEBTC is showing the highest volume in almost two years; this is the start of a new uptrend.
Such huge volume is never the end, only the start.
➖ Low volume on the drop, signals the end of the bearish wave.
➖ High volume on the breakout, signals the start of the bullish phase.
HIVEBTC is going to grow and is going to grow I don't know for how long, but it will be big and strong and it can be bought. It is early, it is easy and it can be profitable. Today's breakout confirms the bullish bias, it is early and there is plenty of room for prices to move higher.
Just a quick update to show you a nice time dependent opportunity; a get in and get out trade.
There will be more. Opportunities are endless in this market.
Thank you for reading.
Namaste.
HIVEBTC trade ideas

HIVE | Major Down-wave Bullish? (300% Easy Growth Potential)Only Alan would call this out as a bullish chart setup, a great entry timing or buy opportunity... Why is that?
➖ HIVE has been going down since November 2021.
Red, down, down, down; no forgiveness, no pause, nothing. Straight down.
This is good, if you are out.
Because... the market cycles through cycles, after it goes down it tends to go up.
I always like to say that I like when a project goes down, because now I am 100% certain that it will eventually go up. If it is going up, the only thing that can happen is that at a certain point it will turn and start to go down.
Ok. I am warming up.
The signals are two here: Price action; the down down stops, and price action starts to become flat on the lower side of the candles. The second signals comes in the form of volume. Trading volume starts to rise. This can be more deeply appreciated by looking at MEXC.
If you plot the MACD and RSI, you will find a super strong, long-term bullish divergence. These tend to show up before a reversal takes place. (Long-term with the MACD, short-term with the RSI —both are showing bullish divergence though.)
Thank you for reading.
Namaste.

Trade Signal for HIVEBTC**Direction:** Sell
**Enter Price:** 4.49E-06
**Take Profit:** 4.39E-06
**Stop Loss:** 4.66E-06
Rationale
This signal has been generated using the EASY Quantum AI strategy, which utilizes advanced algorithms to analyze multiple market factors. The decision to issue a sell signal for HIVEBTC is based on the following key indicators:
1. **Technical Analysis:**
- **Moving Averages:** The short-term moving averages are converging below long-term moving averages, indicating a potential downtrend.
- **Relative Strength Index (RSI):** The RSI is approaching overbought levels, suggesting that a price correction is imminent.
- **MACD:** The MACD histogram is showing decreasing momentum, indicating a weakening bullish trend.
2. **Volume Analysis:**
- Recent trading volume has shown spikes during downward price movements, signaling strong selling pressure in the market.
3. **Market Sentiment:**
- **Bearish News:** Recent negative news and market sentiment in the cryptocurrency sector have led to increased volatility, favoring a bearish outlook for HIVEBTC.
4. **Resistance and Support Levels:**
- **Enter Price:** The chosen entry price of 4.49E-06 is positioned just below a significant resistance level, making it an optimal point to capitalize on selling opportunities.
- **Take Profit:** The target price of 4.39E-06 is strategically set above a critical support level, ensuring a favorable risk-reward ratio.
- **Stop Loss:** The stop loss at 4.66E-06 is placed above recent swing highs, allowing room for minor bullish retracements without compromising the overall trade strategy.
By combining these factors, the EASY Quantum AI strategy has identified a high-probability sell opportunity for HIVEBTC. Traders are advised to follow the signal with the specified entry, take profit, and stop-loss levels to maximize potential gains while managing risk effectively.
Note
Always conduct your own research and consider your risk tolerance before entering any trade. Past performance is not indicative of future results.

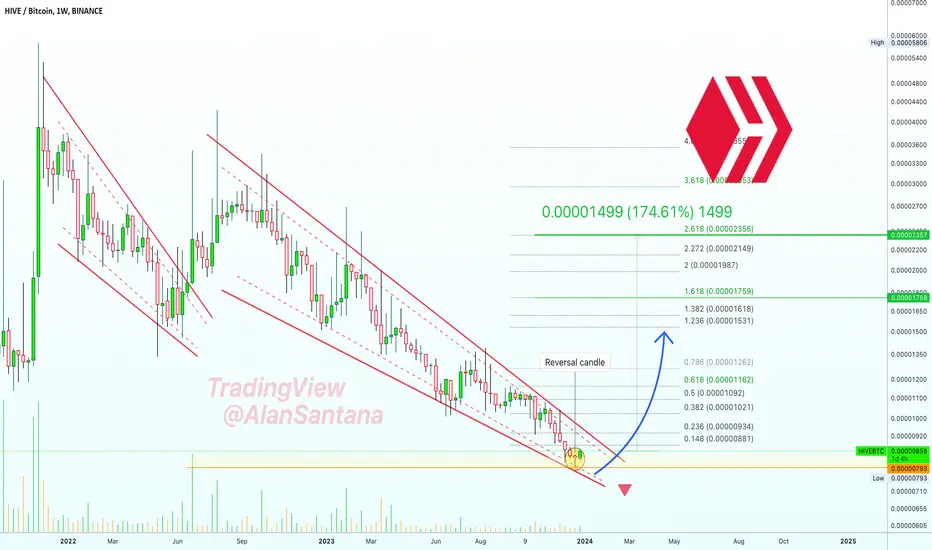
✳️ Hive Hits A Multi-Year Long Low, ATL On The RSI... (175% Pot)The chart looks neat and we are going to keep it simple as usual; These are simple signals.
➖ Hive hit its lowest price since June 2021 vs Bitcoin (HIVEBTC).
➖ Hive hit its lowest reading ever on the RSI 18-Dec, a major signal.
➖ The last session (last week), closed as a reversal candle:
The current candle trades above last sessions close, open and high as well as being the first green week in 1.5 months.
These are early reversal signals, even if a new low hits this is a great chart setup to multiple your Bitcoins.
It is very important to have a long-term perspective when trading bits and remember that 1 BTC = 1 BTC.
Namaste.
Hive coin completed setup for the next pumpHi dear friends, hope you are well, and welcome to the new update on Hive coin with BTC pair.
Previously we caught almost 13% pump of HIVE as below:
Now on a daily time frame, HIVE has formed bullish Gartley move for the next pump.
Note: Above idea is for educational purpose only. It is advised to diversify and strictly follow the stop loss, and don't get stuck with trade.

#HIVEBTC - Long - Potential 15.18%Style: SWING
Direction: LONG
Market: SPOT
Risk: 0.25% - 1%
EXCHANGE: BINANCE
#BTC_HIVE
TIMEFRAME: 720
ENTRY: 0.00001667
⎿ TP2: 0.00001903
⎿ TP1: 0.00001785
STOP: 0.00001549
Volume finding alts following BTC surge above $28k, money flow turning positive with volume spike for HIVE which has pumped out of a downtrend.

Hive coin forming a bullish BAT move for another pump soonHi dear friends, hope you are well, and welcome to the new update on Hive coin.
Our last successful trade of HIVE was as below:
Now on a 4-hr time frame, HIVE is about to complete the final leg of a bullish BAT move.
Note: Above idea is for educational purpose only. It is advised to diversify and strictly follow the stop loss, and don't get stuck with trade

#HIVE/BTC [Hive]: BBand_Breakout We've identified a Bollinger Band breakout on the $HIVE/BTC chart. The price has moved outside of the upper Bollinger Band, which can indicate a potential bullish trend. We may consider buying at the current price zone and targetting higher level.

$HIVEHola!
in a sea of red this stood out, hopped off PSG luckily before it starts dumping or not just the insane amount of liquidity had me worried.
market has a way of humbling each and every one :)
below yellow line is invalidation .
targeting range high at 3500

HIVE/ BTC 1D Chart Update by sharmaji14uHIVE/BTC 1D Chart Update by sharmaji14u
Hello Dear Freinds....
HIVE still in support & Break Trend line
RSI showing also Bullish
So Don't Miss This Big Opportunity
Entry & Target in Chart
I hope freinds you understand my analysis.
Me & my Team trying to best analysis for you Freinds.
~~Please Support Freinds~~
(Not Financial Advice)
~~Best Of Luck~~
!! Thank You My Team !!

HIVEBTCHello friends, today you can review the technical analysis idea on a 1D linear scale chart for HIVEBTC
TARGET
0.00004800
stoploss
0.00002600

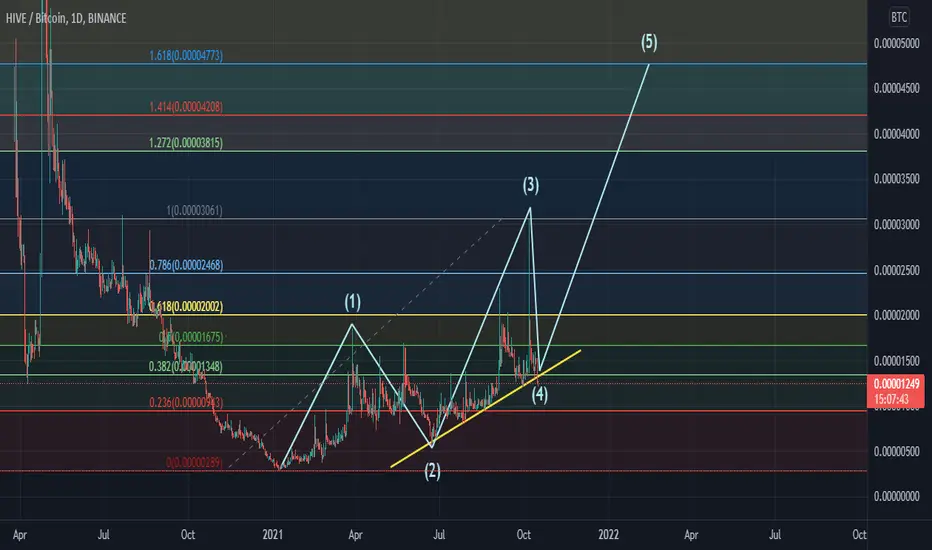
HIVE/BTCHello dear followers and traders,
Just keep eyes on this Elliot Waves or the last Upgoing wave (5) from 8 popular Elliot waves.
I think it looks so nice, and the only thing we need is patient, maybe for 3 to 5 months as your chance.
Good luck for all of you.
HIVE/BTC💱 Buy #HIVE / BTC
💹 Market: Binance
❇️ Buy Price: 0.00001701
☑️ Sell Price: 0.00001735 (+2%)

HIVEBTC is creating an inverse head and shouldersHIVEBTC is creating an inverse head and shoulders on the daily support. IF the price is going to have a breakout from the neckline, According to Plancton's strategy (check our Academy ), we can set a nice order
–––––
Follow the Shrimp 🦐
Keep in mind.
🟣 Purple structure -> Monthly structure.
🔴 Red structure -> Weekly structure.
🔵 Blue structure -> Daily structure.
🟡 Yellow structure -> 4h structure.
⚫️ Black structure -> <4h structure.

HIVE in Bullish TriangleHIVE is in a bullish ascending triangle on a weekly chart. Has a lot of upside if you HODL. Super Bullish.

HIVEBTC - Setup similarities HIVE BTC could be preparing for an extensive bullish momentum. With similarities to the setup seen at the start of 2021 when it had a 400+% run.
Currently in an ascending triangle inside a symmetrical triangle giving some good indicators as to where stop losses couple be placed and when the breakout begins. The convergence between numerous indicators (fisher, KDJ, CCI, RSI Divergence and more) and the price are an early sign of the momentum gathering pace. However caution should be considered with HIVE being a relatively low cap alt coin and prone to sharp drops before continuing.
A similar breakout to that of the start of the year could see the BTC price hit around- 0.000028-0.000032, a 140-175% increase from the current price.
HIVE can be traded against BTC & USDT on binance, making it a good coin to easily see which is the superior asset during any session, it is also prone to short sharp spikes, making it a useful "background asset" for scalping 15-20% trades with very little monitoring needed (every week there is a short sharp spike, keep entries low and set reasonable limit orders to catch these in the moment).

The price is creating a triangle 🦐The price is creating a triangle, and now the price is testing the 4h resistance. IF the price will have a breakout, According to Plancton's strategy (check our Academy), we can set a nice order
–––––
Follow the Shrimp 🦐
Keep in mind.
🟣 Purple structure -> Monthly structure.
🔴 Red structure -> Weekly structure.
🔵 Blue structure -> Daily structure.
🟡 Yellow structure -> 4h structure.
⚫️ Black structure -> <4h structure.
Here is the Plancton0618 technical analysis, please comment below if you have any question.
The ENTRY in the market will be taken only if the condition of the Plancton0618 strategy will trigger.


💡 HIVBTC ANALYSIS💡 HELLO FRIENDS
TECHNICAL, WHEN WE LOOK AT THE GRAPH FOR 4 HOURS, THE Gartley Bullish Formation HAS BEEN CREATED.
THERE SIDE Cypher Formation (Cypher Pattern) CREATION POSSIBLE AVAILABLE !!
THESE TRANSACTIONS ARE HIGHLY RISK MONEY SHOULD NOT BE ENTERED WITHOUT RISK MANAGEMENT
TP1: 0.00001247
TP2: 0.00001549
PROCESSING 0.00001052 INPUT LEVEL: (AT 4-HOUR CANDLE CLOSING)
STOPLOS: 0.00000841 (BASED ON MY OWN MONEY MANAGEMENT) I KEEP THE LEVEL AWAY YOU CAN TAKE IT CLOSE (DEPENDING ON THE SITUATION)
NOT AN INVESTMENT ADVICE.
IF YOU USE ANALYSIS, REMEMBER TO LIKE AND FOLLOW👍👍👍👍👍👍
IF THERE IS SOMETHING WRONG ABOUT THE FORMATION, YOU CAN GET THE WARNING.
"EDUCATIONAL PURPOSES"
Gartley Bullish
The retreat from A to D should ideally be 61.8% or 78.6% of the XA leg.
• A valid ABCD formation should be observed from the A level to the D level.
XA and AD must be time-matched.
• AD time should be between 61.8% and 161.8% of XA time.
At some times the ABCD pattern retracts 100% of the XAB leg. (Double Bottom)
• In this case, XA and AD time should be equal for a true double dip.
Failure of the pattern indicates the continuation of the bear market, and prices could retreat by 127.2% or 161.8% of the XA leg.
Cypher Pattern
The Cypher formation (first described by Darren Oglesbee) is a 4-legged formation.
The difference of this structure from Gartley is that point C can pass below point A. For this reason, the probability of occurrence is lower and longer than Gartley. Because, after a bottom or top is broken and a new bottom-peak is formed, the previous bottom-top is most likely to be turned into support-resistance.
Point C should be at Fibo 127.2 or 138.2. It is very rare for this structure to form at the level of 161.8.

HIVE SQUEZE MOMENTUM - PAMPHIVE is printing a some nice candles bellow the ribbon - needs to escape - once out of red zone - may pump to target

HIVEBTC - Long - Potential 13.57%HIVEBTC - Long - Potential 13.57%
Exchanges: Binance
Signal Type: Regular (Long)
Entry Zone:
0.00001005 - 0.00001025
Take-Profit Targets:
1) 0.00001093
2) 0.00001167
Stop Targets:
1) 0.00000953
Trailing Configuration:
Entry: Percentage (0.0%)

HIVEBTC <2h Supply and Demand Analysis | 16.04.2021Supply and Demand Analysis on a shorter timeframe.

HIVE will move Strong and Fast!HIVE is ready for a big move!
THIS IS NOT A FINANCIAL ADVICE, PLEASE INVEST AT YOUR OWN RISK
