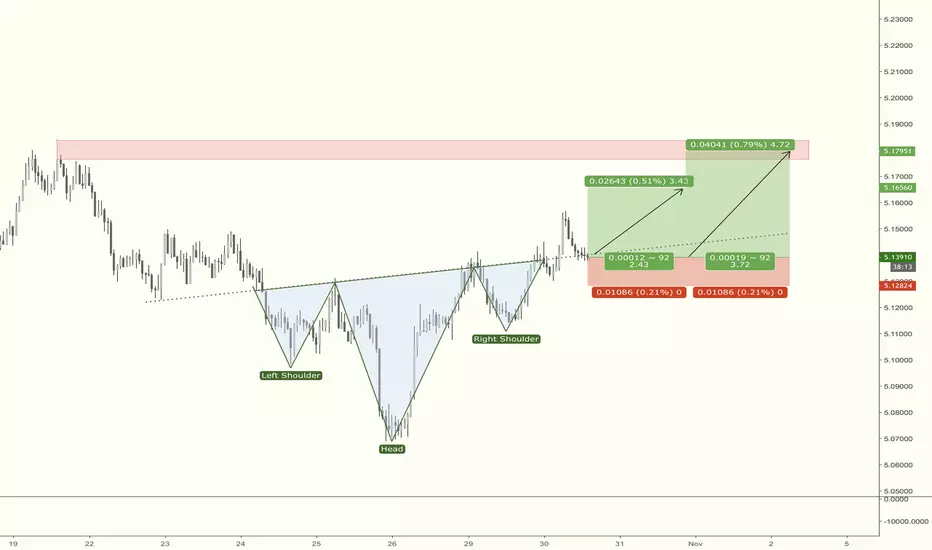
NZDHKD - Bullish TrendBased on the chart pattern analysis, it appears that the price is forming higher highs (HHs) and higher lows (HLs), which indicates a bullish trend.
Furthermore, the Relative Strength Index (RSI) does not show any divergence currently.
I recommend taking a long trade with a risk/reward ratio of 1:1
Please note that this is my personal analysis and trade plan, and it is important for you to conduct your own research and risk management strategies before making any trading decisions.
HKDNZD trade ideas

W9.1-24 NZDHKD BULLISH IDEA(HARMONICS BULLISH PATTERN)potential Bullish Entry
Dow Theory In Place - Higher High and Higher Low Expected in Place
Formation of Harmonic Bullish reversal Pattern coupled with bullish divergence at potential reversal zone (PZR)
Entry at the new HH
SL & TP Levels are defined.

Perfect automated detection of 3Drive pattern - ShortA bearish-type 3Drive pattern occurred.
Also on the daily chart, bearish-type BlackSwan pattern is occurring.
Short after seeing the rebound.
*Harmonic patterns are automatically detected using the indicators below.
- Harmonic auto-detect PRO

nzd hkd long 15 min good morrning all as we see nzd/hkd in support level in 4h timeframe best opportunity to buy in this level to hit target tp = 4,5417 and maybe more
dont forget to give us your idea in comment

BULLISH MOMENTUMHELLO TRADER'S THIS IS MY BULLISH TREND ANALYZE . WAIT FOR COME KEY LEVEL AFTER TREND CONTINUE TO UPTREND YOU CAN ENTRY .THIS IS MY OPINION ONLY NO MORE SIGNAL .

BEARISH CALL This is my bearish trend idea, now during bearish flag you can see it .Wait for clear breakout to downtrend after you can entry, because the overall bearish trend . Only in my opinion.

HKDNZD submerging Similar to HKDAUD, the Kiwi variation of the pair is dropping also. Zigzag forming now, in C Wave. Fibonacci extension gives me three goals in purple, and invalidation is in red as per usual. Remember, this is not financial advice - your decisions are your own.


NZDHKD, Cup-and-Handle (bullish)STATUS = Confirmed
CURRENT CONFIDENCE = 60%
TARGET (EXIT) PRICE = 5.104368 HKD
BREAKOUT (ENTRY) PRICE = 5.088184 HKD
DISTANCE TO TARGET PRICE = 0.15% (75.0 pips)
EMERGED ON Jul 20, 09:00 AM (UTC)
CONFIRMED ON Jul 20, 09:00 AM (UTC)
WITH CONFIDENCE LEVEL = 72%
The Cup-and-Handle pattern identified by Tickeron’s AI
The Cup-and-Handle (sometimes called Cup-and-Holder) pattern is formed when the price of a security initially declines and then rises to form a “U”like rounded shape (1, 2, 3, also known as the Cup). Once it forms the right lip, it is characterized by short, relatively straight price decline (from 3 to 4) forming the handle.
The declining handle potentially forms due to mounting selling pressure created when the security tests its high at the right cup lip. After the sellers give up, the security has the potential to break out to the upside.


NZDHKD. Will the price fall continue?Hi subscribers.
at the beginning of the month,
the price began to rise,
then reaching a key level,
the price fell again and will continue to do so to the support level.
If you liked this idea, please like and subscribe to my profile.
This idea does not provide the financial advice.


NZDHKD. The price is in the falling channel.Hi subscribers!
Exactly 2 months ago, the price was at the resistance level,
after which the price began to fall steadily down in the falling channel,
which means that the price target is at around 4.80000. Good luck.
If you liked this idea, please like and subscribe to my profile.
This idea does not provide the financial advice.

NZDHKD. Cap and handle. Hello dear subscribers!
Consider the very rugged NZDHKD currency pair.
In this graph, a cup with a handle is clearly visible.
this means that the price is likely to go up!
Good luck to you!
If you liked this idea, please like and subscribe to my profile.
This idea does not provide the financial advice.

NZDHKD Buy Hi all ,
This is one of our free trades of the week . We are looking for a breakout of this W1 channel through a swing flow .
Entry and sl Marked .
many Thanks.


NZDHKD LongMultiple entries here based on a few systems I am testing. All based on ATRs and pull back ranges.

NZDHKD LongTook EMA early signal. 2nd signal is now present for potential continuation. Will wait for Sunday open and Monday price action.

NZDHKD highly risky entry H3 RR=7Price at previous resistance level and top of rising channel and we have a bearish shark price might test previous levels and form a cypher pattern . For a sell at 5.36519 , SL at 5.38770 and TP at 5.20761 you get a RR ratio of 7

NZDHKD BUY LIMIT
ALERT SIGNAL FOR POSITIONAL
TRADE ALERT SIGNAL
DATE 03/09/2018
NZDHKD BUY LIMIT
THANK YOU
*SUBJECTED TO MARKET RISK
Understanding the importance of each or these trading rules, and how they work together, can help traders establish a viable trading business. Trading is hard work, and traders who have the discipline and patience to follow these rules can increase their odds of success in a very competitive arena.
Personally, I like to use a system that has the highest reward to risk, which means that I tend to look for turning points at support and resistance levels because these are the points where it is easiest to identify and quantify the risk. Support is not always strong enough to stop a falling market, nor is resistance always strong enough to turn back an advance in prices. However, a system can be built around the concept of support and resistance to give a trader the edge required to be profitable.
