GLD | NeutralGold is still struggling for the uptrend, it looks neutral/bullish on daily chart but still bearish on weekly.
Still unclear for longer opportunities.
2840 trade ideas

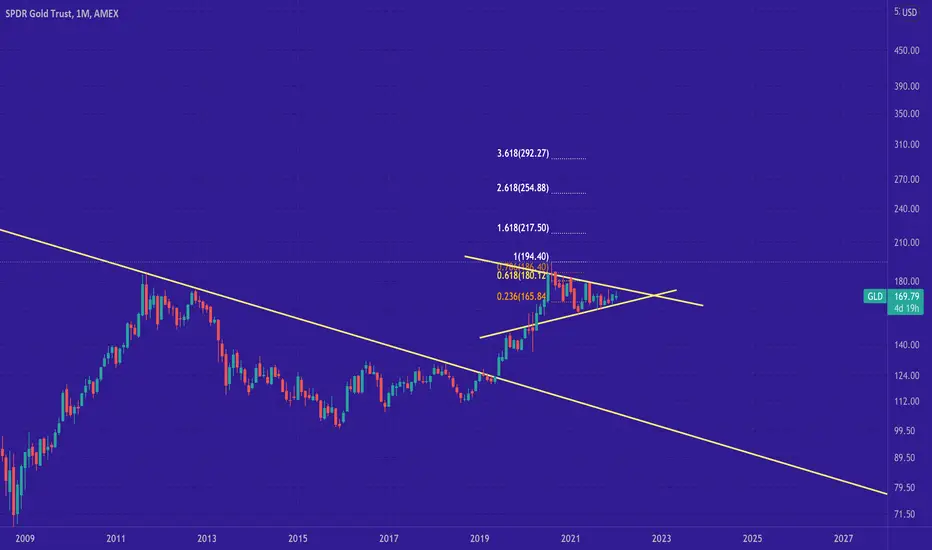
GLD Long Term $1350-$3750+On the monthly chart it's very obvious that gold created a almost decade long base where it traded sideways. Typically such moves indicate accumulation of the asset, and on the charts look like "cup and handle" formation. Over last year and a half price has been in the "handle" part of such formation. It is very bullish long term for gold. Outside of the chart there are also obvious reasons for higher prices in gold. Fed has been trying to achieve inflation, which is finally here. A lot of commodities already had large price increases over the last 1-2 years and gold seems to be the last one in line. I came to the conclusion that once price is on the move we might see higher levels than everyone anticipates. I dont have a specific price target, but I noticed a trendline that is extending from 2006-2011 bull market. If price were to start going up vertically in the next few quarters it would have to reach $1,350 to retest that trendline. Assuming price wont go immediately vertically, and that bull markets might take years to complete, say in 6 years that trendline will be hoovering around $3,750, and price intersection with that trendline goes up dramatically as time goes on.
I think the moral of the story for me here is simple: $$ invested in gold has a possibility to 9x-25x over next 6 years or more over longer time frame. Considering how gold has been hated lately and Bitcoin proclaimed as a "new digital gold" by a lot of media outlets only makes this case stronger. Once gold is running and everyone is talking about it, then it will be time to reduce exposure and sell.

GLD $157 then $195 and higherGold has been consolidating since Aug of 2020, after prior upwards move. In my view long term price should increase substantially, primarily driven by inflation. In the short term I am expecting a move to $195. Prior to this move I am seeing a decent possibility for price to reach about $157 which could coincide with Fed's rate hikes and or stock market decline. At this point everyone sees cup and handle formation (on monthly chart) and once price starts to itch above $195 we should see long term bull market.

Gold ~ GLDI want to see a breakout to the upside between now and march and i'm quite confident it comes.
$GLD largest weekly inflow since covid crashspdr gold trust had its largest weekly inflow since the March 2020 covid bottom.
gold is breaking out of a bullish flag + triangle formation that started February 2020.
easy $2000+ , anyones guess after that
my favorites $NEM $GOLD $AUY $HL $MAG

$GLD breaking outGold has been the worst inflation trade of 2021. Maybe it was due to the inflation trade was not enough with alternative non correlated assets like bitcoin and others. We have seen people flying into these "uncorrelated" assets only to see them become more and more correlated to market moves. Gold has been the uncorrelated asset for a long time. With this breakout, it is easy to see the direction of fund managers. Safety is becoming more important and there is very little safer (to institutions) than gold. $166 or $162 stop prices are good levels to make sure you do not get stuck holding the bag. My firm moved from underweight alternative strategies to overweight at the beginning of the year. Gold, oil, floating rate funds and a few other places can shield you from the growth drawdown that is expected. Lastly, I expect a bounce here soon to suck in more stupid money before a further decline in indexes so no rush. Average in over the next couple months as prices can easily reach $200+ in coming months. From there, we could reach $300 if fed cannot control inflation. Risk return here is worth a look.
This is not intended as investment advice. It is for informational purposes only. Good luck!

Gold poking its head above pennantGold has formed a decade long Cup & Handle and looks ripe for a major break out from a bullish pennant after a long period of consolidation. We are in the ideal macro setting considering inflation and selloff in equities.

$GLD Ready to Breakout?Looks like GLD is putting in a series of higher lows except one oops lower. In addition, it is in a wedging pattern which is showing less volatility. If you are a Mark Minervini fan, a Volatility Contraction Pattern (VCP). Chances are good if this break to the upside (it's close) with volume, it could be a good long trade. If I take this trade my stop would be just below the short term downtrend line. Ideas, not investing / trading advice.

GOLD WILL PROVE ITSELF AND PREVAIL AS SAFE HAVEN AMIDST SELL-OFFAmidst current volatility and increasing fear, inflation, supply cuts, China's uncertainties, pandemic, Fed's decision making --- Gold is holding. This may trigger a breakout upside and leave retailers behind the surprise. Institutions may be shifting cash to safe havens like this instead of a more speculative assets.

make gold great again :/last days we see a volume increase and some bullish indikators like momentum and stochastik. but also we're hitting a gap resistant in the gold-ETF. i would wait for a consolidation respectiv a bounce back to the 170$ support to get into it.
overall i think with high inflation and all the crisis over the world goldcould be more attractive in the next time.
also the kryptos bounced back hard which is due to the fact that the interest rates are climbing a bit. kryptos are the new gold some people say and yes thats true. but now could be maybe a little switch to gold back again.
have a nice day, greetings from germany

Gold LongDescription on the chart.
The idea is to play a possible short trap that could fuel a movement towards the upside.

$GLD Testing Resistance Again.$GLD testing resistance on the downward trend line. Volume was massive today. Looking for follow through and a close above that downward resistance line. Looks like support was established on the low of the bearish engulphing candle on the monthly chart. I'm thinking that the high of that candle will offer resistance if the downward wedge line is flipped. (Perhaps some minor resistance at $174 as well) The volume was pretty bullish IMO. Looked like the most buying in months. Can GLD get above the wedge line?
I took a position today on the close. I'm looking for a close above the wedge line to add. I'm using this weeks low as my stop.
What's everyone's thoughts, feelings and ideas?

$GLD wants to break out of the multi-month bullish pennantNeeds to be confirmed on the daily and weekly chart. $GLD attempting to break out of its multi month bullish pennant. Recent ATHs are a minimum target.


I'm diggin' GOLD, and you should be too.I like GLD. At least right now I do. A rather symmetrical triangle has formed, and normally that implies continuation. That's why I have zoomed way out to the weekly (and even monthly) bars to see the past trend which it is supposed to be continuing. If you look on a long time frame the last leg down looks very much like a bull flag correction and it's reasonable to think it'll break upwards. If gold is still valued as a hedge against inflation it should also ride the tailwinds of the current macroeconomic situation.
I put the bollinger bands on to show that volatility has also lowered (bands have squeezed together). This is normally a precursor to a big move afterwards..... and in this case I believe most evidence is pointing towards the sky.


GLD initiated bullish crossover last monthGLD triggered a bullish aggressive crossover last month (Dec) within what looks like a multiyear bull flag/bull pennant. If successfully consolidating in bull pennant, could produce a new leg higher in the coming months/years. Dependent on the following factors: falling real rates (higher inflation / lower nominal rates - one or both), USD relative to global currencies, precious metals demand, narratives, falling economic activity.

$GLD Decision Time.Looks like an epic cup and handle in the making for $GLD. It's getting close to make or break time. I'd like to see a break above that long term downward trend line on the possible handle. The $DXY chart suggests that the dollar is headed for a secular down trend. That chart is also getting close to an inflection point IMO. Maybe the Gold bugs finally get their day in the sun? A break above that downward trend line would be bullish and a good entry point for those with a bullish bias.

Gold (GLD) is set for a major breakout to the upside!In this article I will explain why we at Dow Experts Finance have recently increased our exposure in our corporate investment portfolio to Gold by buying into the SPDR Gold Shares (GLD) trust, what our economic projections are for 2022 and why we believe that investors need to be highly cautious in the coming months.
The last more than a decade has been defined by a generally loose monetary and fiscal policy with artificially low interest rates, Quantitative Easing (QE), falling bond yields and consistently rising stock prices. We discussed all of these components, their inter-correlation and dependence in our detailed macro analysis published back on June 29th, 2021, where we accurately predicted the strong appreciation of the USD in the 2nd half of 2021, despite the fact that the broad consensus in the market at the time was for a weaker US dollar throughout 2021.
You're welcome.
Now, it’s time for us to share with you our analysis and thoughts on where we see the global economy, interest rates, inflation, bonds yields and of course stock prices heading in 2022. We believe that having the right macro economic framework and understanding of how leading economic forces and indicators affect the demand for money as well as goods and services globally is essential for being successful as an investor in these highly complex times. Being able to recognize major trends, correlations and structural changes allows you to efficiently optimize and re-balance your investment portfolio in a way that will ultimately help you to stay one step ahead of the market.
Today's analysis will focus exclusively on Gold, as we will be releasing our full macro investing outlook for this year in the coming weeks and we don't want to overlap too many things between the two articles. At any rate, our full macro investing outlook paper will present you with a much deeper dive, showing you where we see the best trading and investing opportunities in 2022 and beyond.
The Technical Set-Up
Apart from the great cup and handle technical formation on the monthly chart, which is a strong BULLISH continuation pattern, GLD is also expected to receive a meaningful boost from a weakening US DOLLAR and the elevated levels of inflation that we expect to see in the US moving forward.
The Cup & Handle technical pattern currently in play has been forming since the lows at around $40/oz set all the way back in 2005. As you can see on the chart below the price action has been characterized by a sharp price rise in Stage 1; a corrective phase with the formation of a broad base, Stage 2; another strong rally (Stage 3) taking the price back to the highs reached in Stage 1; a minor profit taking correction (Stage 4). This is a textbook set up for a meaningful multi-year rally for Gold, especially considering the fact that it is on the monthly chart.
The new mandate of the Fed
The Federal Reserve has shifted its growth mandate to a price mandate at the end of 2021, which means that achieving price stability and lower inflation readings is now a more important goal than chasing growth and pushing equity markets higher with artificially low interest rates and generally loose monetary policy conditions.
So, what does that mean?
It means that in the event of a sharp correction in the US equity markets caused by the expected strong tightening in monetary policy conditions, the Fed will be less likely to jump in to the rescue of equities by lowering the benchmark interest rates and resuming its QE program (as it did back in March of 2020). Reason being, such actions would simply throw gasoline in the inflation fires in the economy.
The current environment
- We have highly inflated US equity markets sitting at all-time highs;
- A weakening US Dollar with a descending triangle formation on the monthly chart with 4 rate hikes already priced in for 2022, thus leaving it a very limited fundamentally supported upside from here. In case the Fed is unable to complete all 4 interest rate hikes in 2022 and/or interest rate expectations start shifting for whatever reason, the US dollar will experience a major sell-off.
- A high inflation up until now mainly driven by supply-chain bottlenecks, which is expected to stay relatively high in the foreseeable future.
- The weakening US Dollar will further increase the inflation in the US economy for the following reasons:
Import prices will rise causing a degree of imported inflation
The rise in aggregate demand from cheaper exports
The fall in the value of the dollar may reduce the incentives for firms to cut costs because they get an ‘easy’ improvement in competitiveness. Therefore, a fall in the dollar may harm long-term competitiveness.
- A hawkish Federal Reserve with a price mandate instead of a growth mandate
- Unfavorable demographic trend with the highest ever number of people expected to leave the workforce in 2022 (baby boomers retiring).
Conclusion
We believe that the Federal Reserve is already way behind the curve with its tapering and tightening efforts as it is still technically injecting liquidity into the market with over $60 billion worth of assets bought this month alone.
Moving forward, after concluding its tapering process in March, 2022 the Fed will make an attempt to catch up with the running inflation, but will still be somewhat limited in terms of the actual pace of policy tightening as they would not want to sent the economy into a deep and prolonged recession. Furthermore, with the excessive amounts of credit injected into the system over the last few years, the Fed is well aware that if asset prices collapse dramatically, that would mean that the collateral of these record levels of public and private debt will go down, reducing personal wealth and making it much more difficult for borrowers to service their loans. In addition to that, if inflation stays relatively elevated for prolonged periods of time that will also eat away from the purchasing power of consumers, thus making their wages and earnings less valuable.
So we might be heading towards an economic environment where, asset prices come down as a result of tightening of monetary policy conditions, rates go up but fail to completely subdue the raging inflation as they are simply starting from a very low level (0.25%) and will take the Fed a long time in order to get them back above 2% or higher. This would then lead to a further erosion in the purchasing power of the end consumer, thus lowering the Aggregate Demand in the US economy and lowering the Real GDP moving forward.
On the other hand, the current demographic mix and the millions of people expected to leave the workforce this year, together with the continuous technological innovation present in the economy are both going to exercise their respective deflationary pressures moving forward. We hope that these developments could also help the Fed in the fight against inflation putting somewhat of a natural lid to how high inflation could rise in the long run.
We believe that the economy would eventually self-correct and stabilize in the long run, but we will definitely have to go through a period of economic contraction in order for that to happen.
Gold is widely considered as a safe-haven asset, which tends to outperform in times of uncertainty, volatility and lower GDP growth, thus making it an attractive asset for 2022 and beyond!
Follow & Copy us @DowExperts on eToro for more detailed market analyses, profitable trading ideas and a consistent portfolio performance!

waiting for a break past one of my trendlines 🧐gld stuck between top trendline resistance and trend support, not much movement recently.
It should see a big move once one of the resistance areas break though.
over 173 we can target 179-191.4, under 162 we can target 152.
like and follow for more! 💘

GLD BullishWe see a fresh MACD cross in addition to the D+ crossing over the D- on the ADX. The most recent price action is very bullish starting 12/15 when we saw a double bottom and rally back above the POC line (1 year).
9 day ema is crossing the 50 SMA and the most recent candle was very big and green and filled the down gap from a few days prior.
With today's high inflation number I am looking at GLD to rally in the mid to long term.
target: $174.67 and possibly back to all time high later this year.

GOLD / GLD heading higherWhen zooming out on the chart, we notice a large cup-n-handle formed primed for a breakout. Interesting timing of the handle formation right around the time that the Fed will be raising interest rates which will cause overall market weakness. On the shorter timeframes, the charts are indicating GLD and GOLD have formed Bull-Flag patterns, one of which is in process of a breakout.
Personally, I have invested half of my commons account long into GLD for the 2022 and 2023 gold rush to safety. As always, this is my trade plan and is not deemed financial advise or a solicitation to buy or sell any security or asset. The stock markets contain risk and you should make your own decision based upon your risk reward profile and tolerance.

$GLD - Is Gold ready to takeoff?$GLD - SPDR Gold Trust formed a decade long base cup and handle. Gold could see its next big move up.
