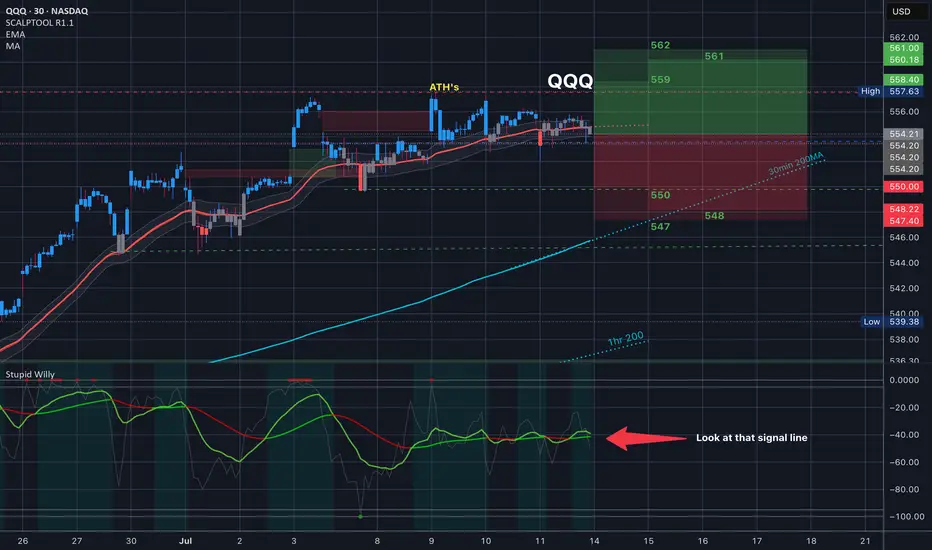
$QQQ Tomorrow’s Trading Range and everything in it /// 7.14.25Tomorrow’s Trading range and everything in it. How are you playing it?
Key stats
About INVESCO QQQ TRUST UNIT SER 1 ETF HK (HKD)
Home page
Inception date
Mar 10, 1999
Structure
Unit Investment Trust
Replication method
Physical
Dividend treatment
Distributes
Distribution tax treatment
Qualified dividends
Income tax type
Capital Gains
Max ST capital gains rate
39.60%
Max LT capital gains rate
20.00%
Primary advisor
Invesco Capital Management LLC
Distributor
Invesco Distributors, Inc.
QQQ is one of the most established and actively traded ETFs in the world, albeit one of the most unusual. The product is one of a few ETFs structured as a unit investment trust. Per the rules of its index, the fund only invests in nonfinancial stocks listed on NASDAQ, and effectively ignores other sectors too, causing it to skew massively away from a broad-based large-cap portfolio. QQQ has huge tech exposure, but it is not a 'tech fund' in the pure sense either. The fund's arcane weighting rules further distance it from anything close to plain vanilla large-cap or pure-play tech coverage. The ETF is much more concentrated in its top holdings and is more volatile than our vanilla large-cap benchmark. Still, the fund has huge name recognition for the underlying index, the NASDAQ-100. In all, QQQ delivers a quirky but wildly popular mash-up of tech, growth, and large-cap exposure. The fund and index are rebalanced quarterly and reconstituted annually.
Related funds
Classification
What's in the fund
Exposure type
Electronic Technology
Technology Services
Retail Trade
Stock breakdown by region
Top 10 holdings
$QQQ Tomorrow’s Trading Range and everything in it /// 7.8.25Tomorrow’s Trading range and everything in it. How are you playing it?

QQQ: Expecting Bearish Movement! Here is Why:
The price of QQQ will most likely collapse soon enough, due to the supply beginning to exceed demand which we can see by looking at the chart of the pair.
Disclosure: I am part of Trade Nation's Influencer program and receive a monthly fee for using their TradingView charts in my analysis.
❤️ P

The Myth of Win RateOne of the most common questions I get from QS members:
“What’s the win rate of the signal?”
Sounds like a smart question. But it's often coming from the wrong mindset — the same mindset as a student cramming for a test, hoping for one perfect answer key that’ll give them a 90% score and an easy win
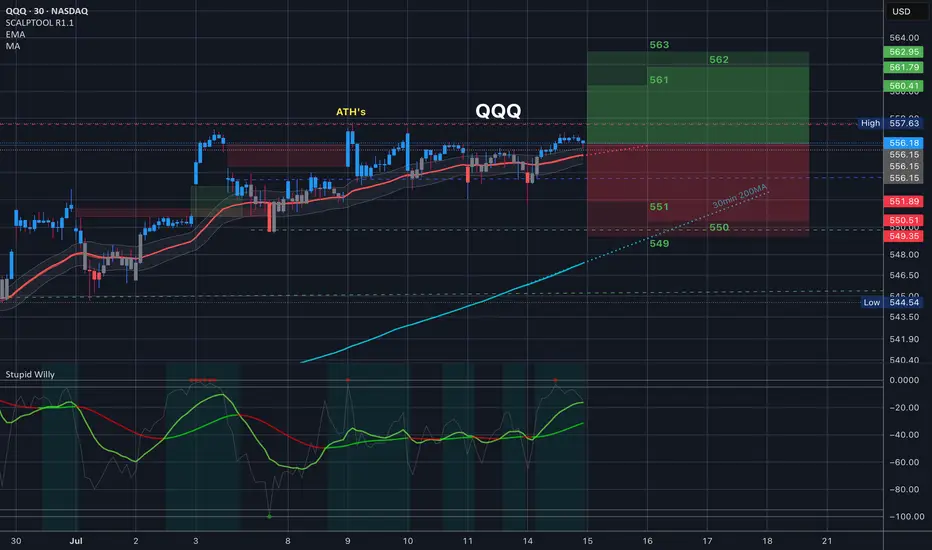
$QQQ Trading Range for 7.15.25 and everything in it for CPI
Tomorrow’s Trading range and everything in it. We have CPI in premarket tomorrow. This is the trading range. let's go.
$QQQ Tomorrow’s Trading Range and everything in it /// 7.10.25
Today’s Trading range and everything in it. How are you playing it?

QQQ July 14th 2025I failed to update my trade journal at the end of last week and am going to try to be better about it this week. I am going to try to keep these posts more brief so I can remain consistent and meet my goal of creating an accurate timeline of my trades. For this week, I am going in with a bullish bia
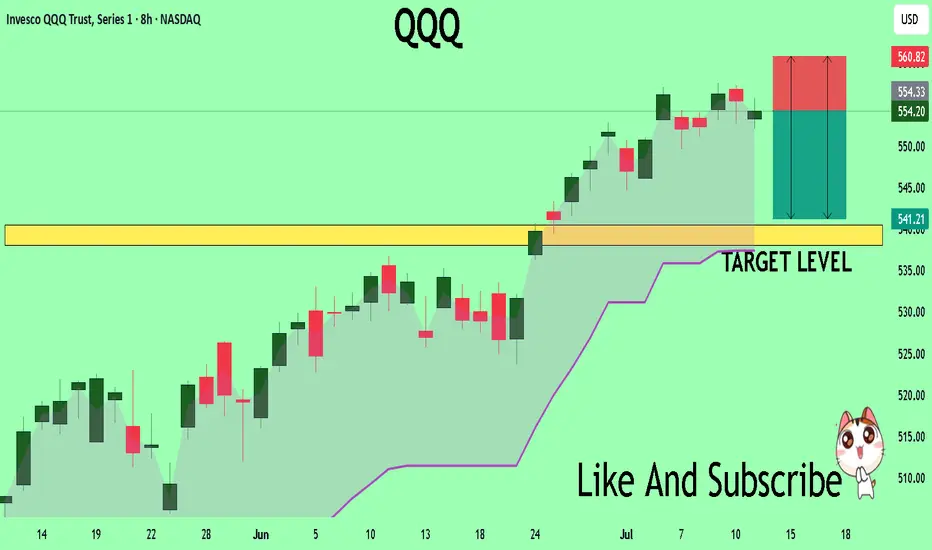
QQQ What Next? SELL!
My dear followers,
I analysed this chart on QQQ and concluded the following:
The market is trading on 554.20 pivot level.
Bias - Bearish
Technical Indicators: Both Super Trend & Pivot HL indicate a highly probable Bearish continuation.
Target - 540.50
Safe Stop Loss - 560.82
About Used Indic
Inevitable Pull Back Coming Soon? | NVDA TSLA AAPL AMZN META MSFStock Market Forecast | CME_MINI:ES1! CME_MINI:NQ1! SPY QQQ
Mag 7 Forecast | NASDAQ:NVDA NASDAQ:TSLA AAPL AMZN META MSFT July 2025 Forecast

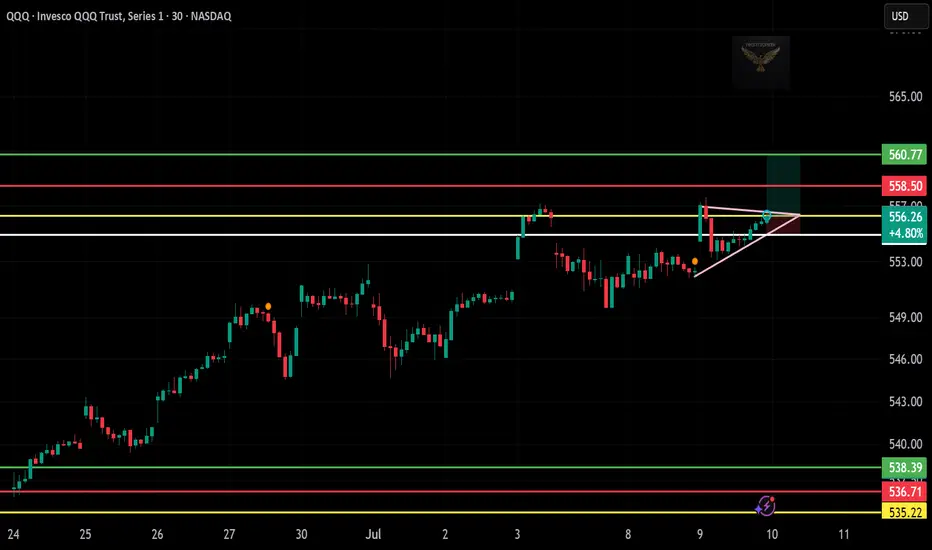
$QQQ Long Trade Setup – July 10📈
Price formed a tight triangle right at resistance—and today we got the breakout. Looks ready for continuation if volume steps in.
📌 Entry: $556.26
🎯 Target: $560.77
🛑 Stop Loss: Below $554.00
⏱️ Timeframe: 30-min chart
🔍 Why I Like This Trade:
Strong bullish flag breakout after retest
Holding
See all ideas
Summarizing what the indicators are suggesting.
Oscillators
Neutral
SellBuy
Strong sellStrong buy
Strong sellSellNeutralBuyStrong buy
Oscillators
Neutral
SellBuy
Strong sellStrong buy
Strong sellSellNeutralBuyStrong buy
Summary
Neutral
SellBuy
Strong sellStrong buy
Strong sellSellNeutralBuyStrong buy
Summary
Neutral
SellBuy
Strong sellStrong buy
Strong sellSellNeutralBuyStrong buy
Summary
Neutral
SellBuy
Strong sellStrong buy
Strong sellSellNeutralBuyStrong buy
Moving Averages
Neutral
SellBuy
Strong sellStrong buy
Strong sellSellNeutralBuyStrong buy
Moving Averages
Neutral
SellBuy
Strong sellStrong buy
Strong sellSellNeutralBuyStrong buy
Displays a symbol's price movements over previous years to identify recurring trends.
Frequently Asked Questions
An exchange-traded fund (ETF) is a collection of assets (stocks, bonds, commodities, etc.) that track an underlying index and can be bought on an exchange like individual stocks.
3455 trades at 4,385 HKD today, its price has fallen −0.82% in the past 24 hours. Track more dynamics on 3455 price chart.
3455 net asset value is 4,376.39 today — it's risen 5.48% over the past month. NAV represents the total value of the fund's assets less liabilities and serves as a gauge of the fund's performance.
3455 assets under management is 2.77 T HKD. AUM is an important metric as it reflects the fund's size and can serve as a gauge of how successful the fund is in attracting investors, which, in its turn, can influence decision-making.
3455 price has risen by 5.11% over the last month, and its yearly performance shows a 8.97% increase. See more dynamics on 3455 price chart.
NAV returns, another gauge of an ETF dynamics, have risen by 5.48% over the last month, showed a 27.05% increase in three-month performance and has increased by 13.60% in a year.
NAV returns, another gauge of an ETF dynamics, have risen by 5.48% over the last month, showed a 27.05% increase in three-month performance and has increased by 13.60% in a year.
3455 fund flows account for 111.04 B HKD (1 year). Many traders use this metric to get insight into investors' sentiment and evaluate whether it's time to buy or sell the fund.
Since ETFs work like an individual stock, they can be bought and sold on exchanges (e.g. NASDAQ, NYSE, EURONEXT). As it happens with stocks, you need to select a brokerage to access trading. Explore our list of available brokers to find the one to help execute your strategies. Don't forget to do your research before getting to trading. Explore ETFs metrics in our ETF screener to find a reliable opportunity.
3455 invests in stocks. See more details in our Analysis section.
3455 expense ratio is 0.20%. It's an important metric for helping traders understand the fund's operating costs relative to assets and how expensive it would be to hold the fund.
No, 3455 isn't leveraged, meaning it doesn't use borrowings or financial derivatives to magnify the performance of the underlying assets or index it follows.
Yes, 3455 pays dividends to its holders with the dividend yield of 0.51%.
3455 trades at a premium (0.44%).
Premium/discount to NAV expresses the difference between the ETF’s price and its NAV value. A positive percentage indicates a premium, meaning the ETF trades at a higher price than the calculated NAV. Conversely, a negative percentage indicates a discount, suggesting the ETF trades at a lower price than NAV.
Premium/discount to NAV expresses the difference between the ETF’s price and its NAV value. A positive percentage indicates a premium, meaning the ETF trades at a higher price than the calculated NAV. Conversely, a negative percentage indicates a discount, suggesting the ETF trades at a lower price than NAV.
3455 shares are issued by Invesco Ltd.
3455 follows the NASDAQ 100 Index. ETFs usually track some benchmark seeking to replicate its performance and guide asset selection and objectives.
The fund started trading on Mar 10, 1999.
The fund's management style is passive, meaning it's aiming to replicate the performance of the underlying index by holding assets in the same proportions as the index. The goal is to match the index's returns.