$QQQ — Bearish Setup Forming Near Highs📉 NASDAQ:QQQ — Bearish Setup Forming Near Highs
Technical Confluence:
Rising wedge structure into prior highs
RSI bearish divergence (momentum fading)
Volume steadily drying up on this recent move
Price stalling under key resistance zone (Feb–April supply)
Execution Plan:
I’ve tightened stops across swing positions
Trailing a AMEX:PSQ buy order in case of wedge breakdown
Watching for a move below ~$530 for confirmation
If triggered, downside targets:
T1: $518 (20 EMA)
T2: $496 (200 SMA)
T3: $470 (gap + structural support)
Risk View:
I’m not predicting — I’m preparing. Structure is extended, internals weakening. Staying nimble, ready for reversal or breakout invalidation.
📊 Feedback welcome
83455 trade ideas

QQQ - Weekly Volatility PotentialGood Morning --
Last week we reviewed the potential of the S&P 500, this week let us take a look at the potential perspective of NASDAQ:QQQ .
IV (17.97%) entering the week is trending 31% IVp on the year and has been gradually lowering as price action grinds higher and out of corrective territory -- This is +2.61% more volatile than near-term trending values of HV10 (15.36%) and only -0.57% under HV21 (18.54%), our monthly trending values.
Looking towards next week, I expect the CBOE:VIX to continually soften IV values as the broader markets push towards all-time highs this week. NASDAQ:QQQ historical values are coiling to where we will soon need a volatility spike, but not just yet -- my weekly price target here is simple (HV10 upper implied range) $539.44 with wicking potential above to monthly trends (HV21 upper implied ranges) at $541.42.
Only time will tell, we can't control the markets but we sure can manage our own risk within them. Remember to always be hedged and come back to join me next weekend as we review the charts for what happened VS our expectation!
CHEERS

$QQQ // June 10 2025 // Analysis & Targets for Day Traders
QQQ really made use of today’s setup. Green signal line, above the 35EMA - making a run to the top of the implied move to close within it!!

QQQ On The Rise! BUY!
My dear friends,
My technical analysis for QQQ is below:
The market is trading on 526.92 pivot level.
Bias - Bullish
Technical Indicators: Both Super Trend & Pivot HL indicate a highly probable Bullish continuation.
Target - 530.98
About Used Indicators:
A pivot point is a technical analysis indicator, or calculations, used to determine the overall trend of the market over different time frames.
Disclosure: I am part of Trade Nation's Influencer program and receive a monthly fee for using their TradingView charts in my analysis.
———————————
WISH YOU ALL LUCK

$QQQ WARNING! 6-7% Downside Possible🚨 NASDAQ:QQQ WARNING! 🚨
Holding steady... for now.
But if we break down out of the Daily WCB and through this wedge, it’s game over—GAP FILL incoming!
💥 MM: $493.31 MT: 16 July 💥
If that happens, I’m cutting all swings FAST. Stay sharp!

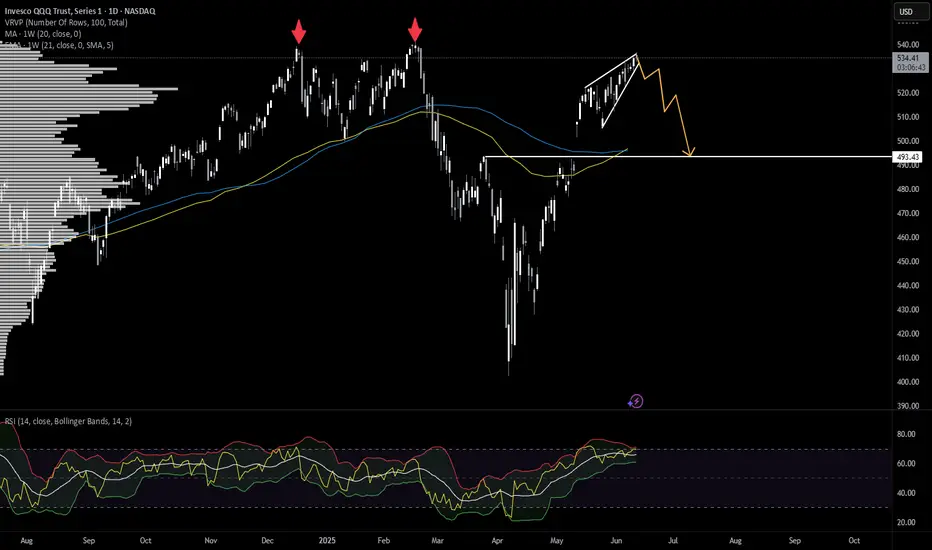
QQQ new lows incoming?QQQ has been consolidating in a massive rising wedge and looks set to break down from it.
Unless price can get back above previous highs, then new lows is the most likely outcome here.
I've marked off support levels on the downside that might be good opportunities to scale in on the long side.
Let's see how low we go.

Bears Intensify... $QQQ - Pullback LikelyBears Intensify... NASDAQ:QQQ
🐻 Falling Wedge Breakdown
🐻 Hammer Candle
🐻 Bearish Wr%
🐻 H5 Flow Increasing

Stock Market Forecast | TSLA NVDA AAPL AMZN META MSFTStock Market Forecast | CME_MINI:NQ1! CME_MINI:ES1! SPY QQQ
Mag 7 Forecast | NASDAQ:TSLA NVDA AAPL AMZN META MSFT GOOG

QQQ ShortMarket has run far enough, even with a significant short term pullback here the overall structure can remain very bullish, with nasdaq breaking it's trendlines recently i expect a move back to 200 day ma at the very least.

QQQ to tap ATH then fill the May 12th gapQQQ to tap ATH or just above based on the trend line then retrace to fill the May 12th gap.

$QQQ // June 17 2025 // CPI Analysis & Targets for Day TradersNASDAQ:QQQ // June 17 2025 // CPI Analysis & Targets for Day Traders

QQQ: Expecting Bearish Continuation! Here is Why:
Looking at the chart of QQQ right now we are seeing some interesting price action on the lower timeframes. Thus a local move down seems to be quite likely.
Disclosure: I am part of Trade Nation's Influencer program and receive a monthly fee for using their TradingView charts in my analysis.
❤️ Please, support our work with like & comment! ❤️

QQQ NOTICE TREND LINE SUPPORT I have now started to position for the transition in the markets I have moved out of all calls again for the 4 time in 4 days each of the trades made $$ . but today is day 39 TD of the rally . And I am looking for a TOP in day 40 TD I have now moved to 40 today then 75% MOC in spy and qqq 5550 555 560 QQQ puts 2026 time zone and 650 in spy . The trendline has held rather nice to help make some nice $$ and we if bullish should now be in early wave 3 of 5 of 5 of 5 .So why buy puts NOW simple answer is It could still be wave c up for wave B or wave D. and That today is day TD39 I have posted a possible Major top due on td 40 and The spiral hold up into june 6th to 9th .I know my risks and am willing to start taking the same stand and positions as I did 11/29 12/6 and feb 18th based on the wave structure and PUT /CALL model . I am willing to This is not for all traders . But I am turning down in NYSI and the NYMO is showing buying is running out but bullish call buying is nearing the two last TOPS . I have 25 % cash and will wait for two things One put call drops to 60 on 5 day or 10 day at 65 second daily RSI is no confirmation . 3rd the qqq reaches 531/534 knowing it could extend to 541/555 and similar in sp cash or the DJI prints a .786 this is a lot but it is part of the game plan best of trades WAVETIMER

QQQ Will Collapse! SELL!
My dear friends,
QQQ looks like it will make a good move, and here are the details:
The market is trading on 529.85 pivot level.
Bias - Bearish
Technical Indicators: Supper Trend generates a clear short signal while Pivot Point HL is currently determining the overall Bearish trend of the market.
Goal - 521.53
About Used Indicators:
Pivot points are a great way to identify areas of support and resistance, but they work best when combined with other kinds of technical analysis
Disclosure: I am part of Trade Nation's Influencer program and receive a monthly fee for using their TradingView charts in my analysis.
———————————
WISH YOU ALL LUCK


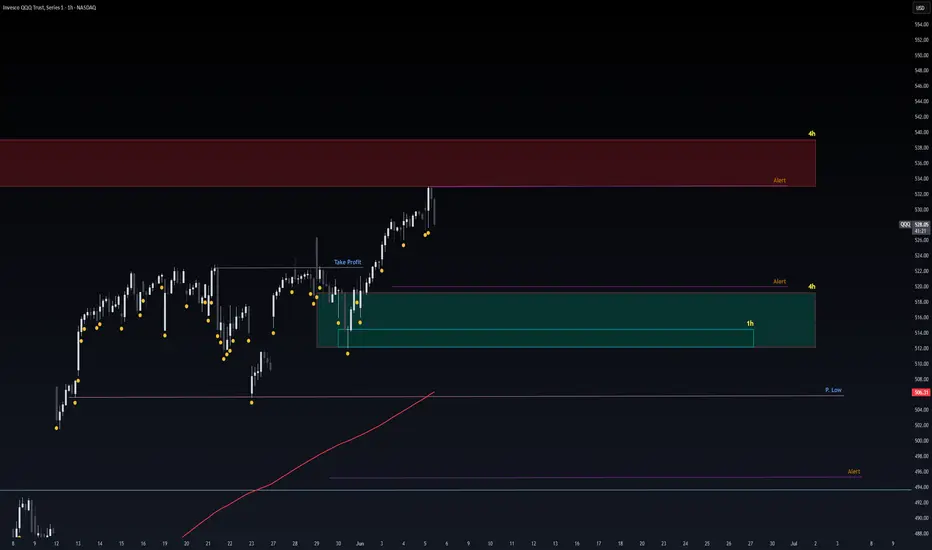
QQQ (Invesco QQQ Trust) – Premium Rejection & Gap Fill Probabili🕐 1H Chart | Smart Money Concepts | Volume: 362.69K
📍 Price: $525.82 (as of June 5, 2025)
📌 Market Context: Nasdaq-heavy ETF reacting near historical highs
🧠 Technical Outlook
🔴 Weak High formed at the Premium Zone around $530–533 — an area of prior liquidity hunts and seller reactivation
📉 BOS + CHoCH (Break of Structure + Change of Character) confirm potential short-term bearish rotation
📦 Multiple Inefficiencies / FVGs stacked below $520, with visible Gap Fill Zones targeting $510 → $490
⚖️ Equilibrium Area: $480–485, where institutional rebalancing may occur
📊 Risk Management Plan
Short Entry Zone: $526–530 (upon confirmation of weak high rejection)
Initial Target: $510 (gap fill)
Secondary Target: $485 (EQ zone)
Stop-Loss: Above $533 (invalidates the rejection thesis)
📌 Risk-Reward: Approx. 3.2R depending on entry
🔒 Position Sizing: Use no more than 1.5% of capital per trade due to macro catalysts (see below)
📈 Probabilistic Outcomes
🟢 Bearish Play (65% Probability): High likelihood of price returning to fill imbalance zones & tap EQ block
🟡 Sideways Chop (25%): If macro remains indecisive, range may form between $515–$530
🔵 Invalidation Bull Rally (10%): Break and hold above $533 invalidates this trade setup
🌐 Macro & Catalysts to Watch
📉 Semiconductor Drag: QQQ is heavily exposed to tech; semis are still underperforming YTD (–17.53%)
🛃 Trade Tensions: Rising tariffs and protectionism (China–US) may weigh on large-cap growth names
🧾 ETF Inflows: While QQQ saw +$571M inflows in early June, positioning could be crowded
💬 Upcoming Events:
FOMC rate decision (June 12)
NVDA + AAPL earnings over the next 10 trading days
🧠 Strategic Insight
Short-term liquidity has likely been swept at highs. Institutions could drive price lower to mitigate risk exposure ahead of major macro events. Expect volatility spikes near economic data releases.
🛡️ This is a tactical swing-to-intraday short opportunity with defined parameters. Trade the levels, not the hope.
#QQQ #SmartMoneyConcepts #GapFill #PremiumZone #RiskManagement #ETFStrategy #MacroTrading #LiquiditySweep #VolumeProfile #WaverVanirInternational


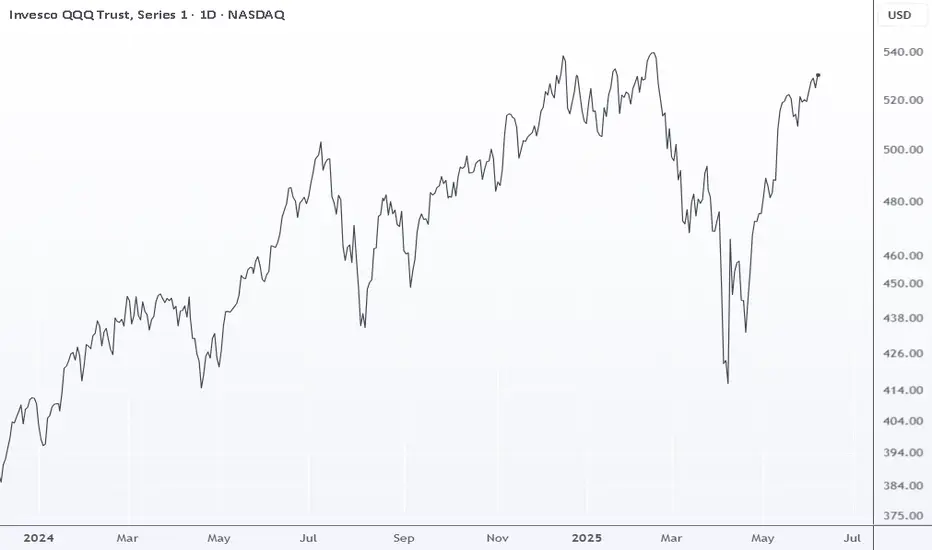
QQQ UPDATEQQQ is trading above the January open at 514.3; but given the high volatility seen in March and April, that’s not a positive setup. The bottom reversal from April already played out with 526 as the target. Taken together, these may be pointing to trouble ahead.
$QQQ // June 6 2025 // Analysis & Targets for Day TradersNASDAQ:QQQ // June 6 2025 // Analysis & Targets for Day Traders

QQQ Calls 6/3 527Retest Previous week high with a Hammer candle stick in premarket
Breaks Above Mondays high
Entry at market open for $527 calls
Target Previous week demand (527)
Got out because I though price was going to reverse back after it passed 524. I need to have confidence on my Trade and really wait it out for my SL and/or TP.

Safe Entry Zoneafter Rejection from the Resistance 4h Red Zone.
we have 4h and 1h Green Zone as Strong Support levels.
Note: Potentional of Strong Buying Zone:
We have two scenarios must happen at The Mentioned Zone:
Scenarios One: strong buying volume with reversal Candle.
Scenarios Two: Fake Break-Out of The Buying Zone.
Both indicate buyers stepping in strongly. NEVER Join in unless one showed up.
QQQ: RetraceWith the rising wedge pattern forming on QQQ, I think we see a retrace to the MAs and the previous resistance at 493 to fill the gap. We have seen a huge bounce and I think we'll see some profit taking up here near the highs. The RSI has also become overbought as well, so I expect a retrace in the next couple of months.
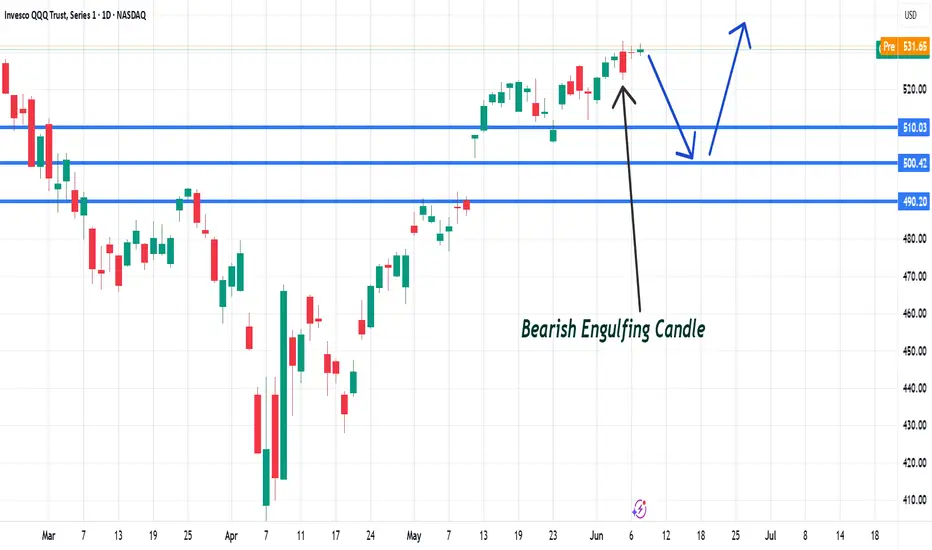
QQQ at the critical area.#QQQ
A Bearish Engulfing pattern has appeared after a strong uptrend, which is typically a reversal signal.
$490.00 – Major support zone
$500.00 – Mid-level support
$510.00 – Closest support turned into potential resistance.
The Bearish Engulfing Candle will be considered invalid if a daily candle closes above its high at $533.05.