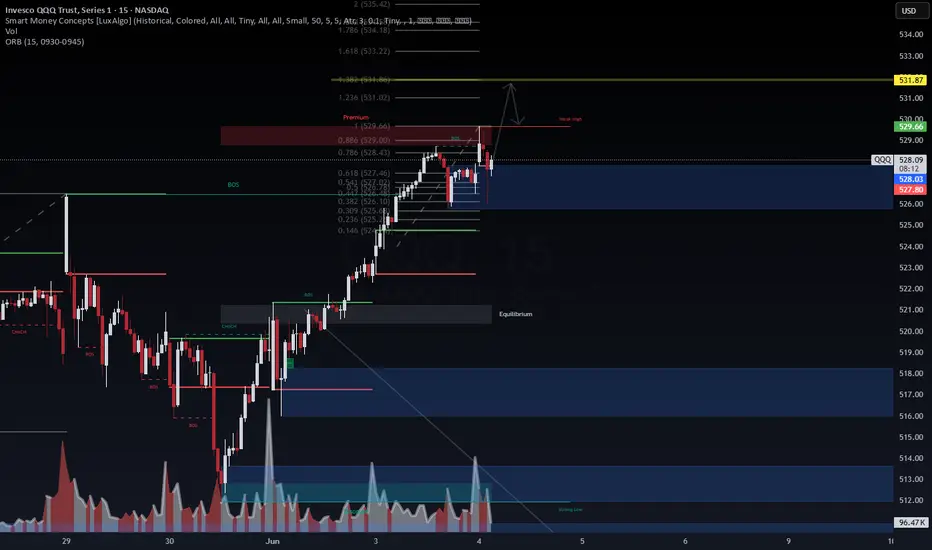
QQQ 15-min – Eyes on Key Liquidity ZonesWe’ve seen strong bullish structure with multiple BOS confirmations. Price is currently consolidating above the 0.618 retracement and reclaiming a previous FVG zone. Volume has cooled off, but key levels around 528.40–529.00 could be revisited soon.
If we reclaim the weak high with momentum, the path toward the 1.382–1.618 extensions (531.80–533.20) may open up. Until then, watching how price behaves around 527.50–526.10 for potential reaction.
🕵️♂️ No need to chase — the setup is developing. Sometimes patience is alpha.
📌 Levels to watch:
Liquidity: 529.00–529.66
Target zone: 531.87–533.22
Demand: 526.10–527.00
#QQQ #SMC #Fibonacci #Liquidity #TechStocks #WaverVanir #PriceAction #SmartMoney
83455 trade ideas
FREE STOCK ANALYSIS! Make Your Requests Below! $$The stock market is setting up for fireworks as we head into June! With sector rotations, breakout setups, and institutional volume quietly reappearing, it's time to dissect the charts and uncover the most asymmetric opportunities in equities right now.
Will June mark the start of a sustained bull run across growth names, or are we still trapped in a range of fakeouts and liquidity grabs? Let’s break it down with clean technical analysis, sharp macro context, and a disciplined eye.
🔹 Which stocks should I analyze?
🔹 Are we seeing real institutional accumulation or another bull trap?
🔹 Key price levels, trend shifts, demand zones, and risk-reward setups
Drop your favorite stock tickers in the comments , and I’ll provide a detailed fundamental analysis with technical insights — all grounded in current market conditions.
📅 Submission Deadline: JUNE 6th, 2025
🔹 Request Guidelines:
✅ Each member may submit one stock
✅ Use the format: AAPL, NVDA, TSLA, etc.
✅ U.S.-listed equities preferred (NASDAQ/NYSE)
Even in choppy environments, clarity creates confidence. The goal is to deliver at least 30 high quality stock analyses to help this community trade smarter, manage risk better, and stay positioned for what’s next.
⚠ Important Reminder:
All shared analyses are for educational purposes only and do not constitute financial advice. Always do your own research and risk assessment before acting on any ideas.
💡 When others hesitate, the sharpest traders position themselves. Let’s dissect this market, find the hidden gems, and capitalize on the setups others are too distracted to notice. 🔍📈
⚙️ Want these breakdowns delivered by AI that thinks like a hedge fund analyst?
Imagine if Warren Buffett had an AI assistant. That’s what I built. Try WallStreet Alchemist AI for completely free. Link in bio
In case you missed the latest analysis I published on NASDAQ:NVDA yesterday just before it exploded LIKE A BAZUKA today 🚀🚀🚀🚀, here it is
Let the analysis games begin!

Swing high on QQQ?My dowsing work is suggesting today is likely a swing high in indexes and there will be a few days down from around here. The level I expect on QQQ is just under 500. I've had some numbers as far as into the 80s as well, but not expecting that this go around.
I posted my roadmap for SPY as an idea for what to expect this week, and this is playing out so far. Today would be the "look above and fail", but we need to get the fail part! If it starts, then I think the target lower is valid.
I also will mention I get the number 6. That could be price or percent. If percent it's down to 495, which makes sense. In terms of price the last swing low was at 506.... idk we'll see.

$QQQ // June 3 2025 // Analysis & Targets for Day TradersNASDAQ:QQQ // June 3 2025 // Analysis & Targets for Day Traders
Look at that sideways consolidation back to the 30min 200MA

QQQ – Precision Setup Into June 13th, Superstitious? QQQ – Precision Setup Into June 13th (Friday the 13th, But We’re Not Superstitious)
Wavervanir International LLC | June 2, 2025
🧠 Trade Thesis
Despite the superstition surrounding Friday the 13th, our plan is simple and technically sound: wait for price to pull back into a high-probability confluence zone and strike with confidence.
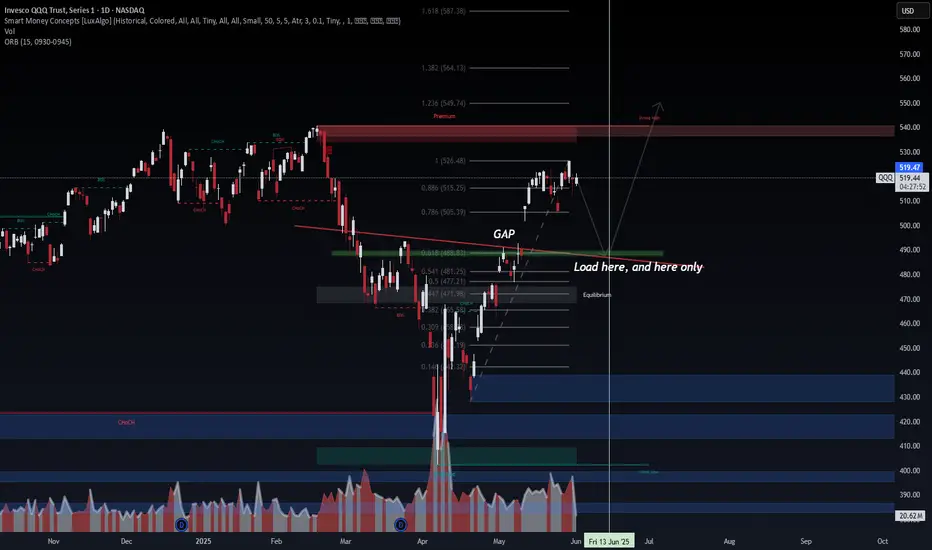
🔍 Technical Breakdown (Daily Chart)
🟥 Premium Zone: $540–550. Price is currently stalling below the 0.886–1.0 Fib zone at $526–$528, showing early signs of distribution.
🟩 Optimal Entry Zone: Around $488, aligning with:
0.618 Fibonacci retracement
Prior CHoCH flip zone
Trendline + Equilibrium support
Volume node clustering
📌 "Load here, and here only" marked for a reason — this is where institutional algorithms are most likely to get involved.
📈 Target: Retest and break of strong high at $549+
📉 Invalidation: Daily close below $477 = re-evaluate structure
🔮 Probability Outlook
Pullback to $488–490 zone: 75%
Bounce to new highs: 70%
Breakdown below equilibrium: 25%
🧠 SMC Context
Recent Break of Structure confirms a bullish bias unless invalidated.
Price above equilibrium but needs a healthier retracement for continuation.
Volume declining into resistance = signs of buyer exhaustion.
📆 Key Date: June 13, 2025 (Friday)
Let’s see if this market follows the script — or throws a plot twist. Either way, we’re ready.
QQQ – Smart Money Concepts Bearish Setup (1H Chart)Wavervanir International LLC | June 2, 2025
🔍 Chart Context:
The QQQ is currently reacting from a premium supply zone after multiple internal Break of Structure (BoS) and Change of Character (ChoCH) events, showing clear signs of distribution at the top.
🧠 SMC Breakdown
Premium Zone Rejection near $521–523 was met with strong bearish reaction and high sell volume (1.22M).
Multiple BoS and ChoCH events signal institutional unloading.
Weak High formation suggests liquidity sweep followed by directional sell-off.
Current candle structure shows an intent to revisit demand zones below.
📊 Liquidity & Target Zones
First imbalance (FVG) zone at $507–510 is likely to get mitigated.
Second key zone aligns with Equilibrium near $487–490, offering the next logical magnet.
A deeper liquidity pool exists at $465–470, consistent with institutional fill behavior.
🧩 Macro View
Tech-heavy indexes underperforming recently amid shifting Fed expectations.
U.S. 10Y yields climbing and sticky inflation may pressure QQQ's valuation multiples.
NQ/QQQ divergence from breadth suggests fragility at the highs.
📈 Trade Idea
📌 Bearish Bias Active
🎯 Short Entry: $517–519 (on any lower timeframe mitigation or retrace)
🛑 Stop Loss: Above $523 (invalidates supply)
✅ Target 1: $507
✅ Target 2: $490
🚨 Extended Target: $467
Probability:
Bearish Continuation: 70%
Reclaim Premium Zone: 30%
💬 Call to Action:
Monitor volume + liquidity interaction near the mid-level FVG. If downside accelerates with confirmation from NQ divergence, we could see a cascade to equilibrium or even deeper. Risk-manage with volatility in mind.
#QQQ #NASDAQ #SmartMoneyConcepts #VolumeProfile #MarketStructure #TechStocks #LiquidityZones #TradingView #WavervanirAnalysis


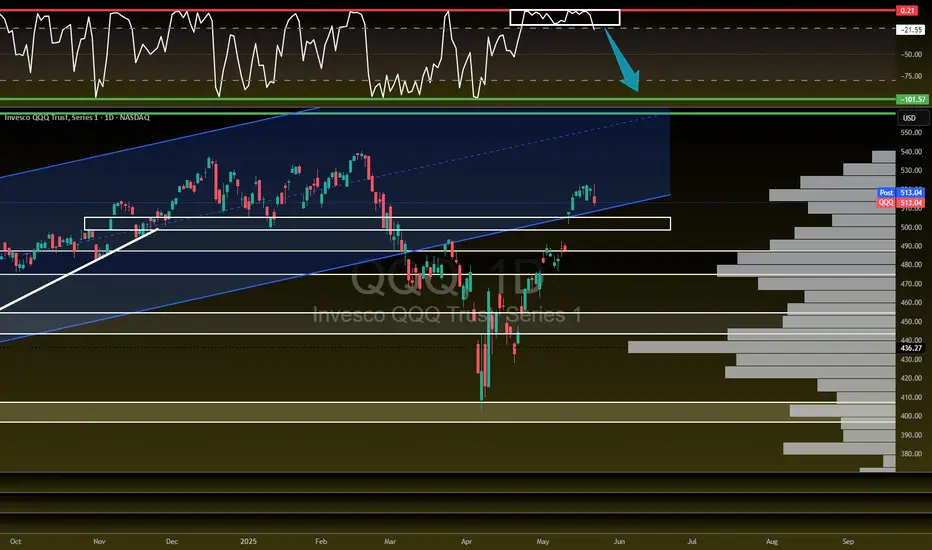
Qqq... almost timeIn the coming the tech sector will rollover and correct 10-12% in the month of june.
This will represent a 50% retrace from April lows
Weekly RSI is tagging Divergence resistance
www.tradingview.com
This space has only room enough to chop around for another few days so I'm thinking some news either comes out over the weekend or next weeks eco data comes out and causes a flush and break of this wedge
The immediate move would be to the 200ma or 495, from there I expect a bounce back to 505-508 before the next leg down
A break and close above 530 would negate this short..
I will go over some of the tech Sectors this weekend..
Don't swing any direction until this wedge is decided, will be choppy and annoying.. Theta decay heavy for 0dte.
Just have patience and fade the pops.. all the signs are there. I've notice a rotation into heath ,utilities and defensive all week despite qqq making new highs
If we happen to close below or near 515 that would leave us with a weekly reversal candle

TOP WAVE COUNT QQQ or SPY both same We had a higher high in the futures at 4 am . since that point we have declining I look for the market to still reach that price .But I know there was a lot of selling overnight today is day 37td since low

$QQQ / May 27 2026 CONTRACT / Analysis & Targets for Day Traders
Only the first contract of the week will be public. GL today, y'all...

QQQ To Be DeterminedUsing the Potterbox strategy, we can see that we successfully bounced off the 4HR cost basis, or median at about $505.60 and closed above the top of the box at about $507.77.
I believe that to continue to the upside, we'll have to first secure the floor above at $511.50 with a 4 hour candle close. At that point, we'll have a chance to punchback with a candle close above cost basis at about $513.84. With that, we can look to head to the upside and use $522 as a price target.
On the other hand, if we drop below the top of the box that we closed above, we could retest cost basis at about $505.60 and if we get a candle close at that end, then we can look to continue downwards towards a $497 price target.

QQQ Trading Opportunity! BUY!
My dear friends,
QQQ looks like it will make a good move, and here are the details:
The market is trading on 509.27 pivot level.
Bias - Bullish
Technical Indicators: Supper Trend generates a clear long signal while Pivot Point HL is currently determining the overall Bullish trend of the market.
Goal - 514.96
About Used Indicators:
Pivot points are a great way to identify areas of support and resistance, but they work best when combined with other kinds of technical analysis
Disclosure: I am part of Trade Nation's Influencer program and receive a monthly fee for using their TradingView charts in my analysis.
———————————
WISH YOU ALL LUCK

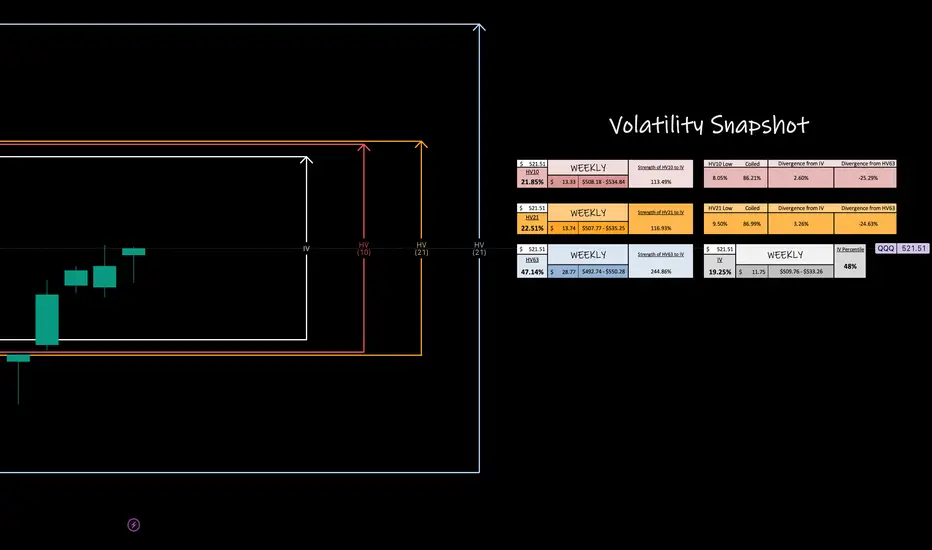
QQQ Weekly PotentialVolatility, expressed through standard deviation, quantifies market elasticity and presents a level of probability and precision that humbles us all.
This week with NASDAQ:QQQ we see that the shorter term trending volatility is resonating like SP:SPX and AMEX:SPY just under our monthly values. Range seems to be expanding allowing for cheaper premium capture per move happening. With any luck, we reflect and increase in volatility with up to quarterly means.
BOOST the post, drop a follow and comment, BUT don't forget to circle back at the end of the week to revisit and observe how our trending markets preformed!
QQQ What Next? SELL!
My dear followers,
I analysed this chart on QQQ and concluded the following:
The market is trading on 521.53 pivot level.
Bias - Bearish
Technical Indicators: Both Super Trend & Pivot HL indicate a highly probable Bearish continuation.
Target - 492.15
Safe Stop Loss - 535.10
About Used Indicators:
A super-trend indicator is plotted on either above or below the closing price to signal a buy or sell. The indicator changes color, based on whether or not you should be buying. If the super-trend indicator moves below the closing price, the indicator turns green, and it signals an entry point or points to buy.
Disclosure: I am part of Trade Nation's Influencer program and receive a monthly fee for using their TradingView charts in my analysis.
———————————
WISH YOU ALL LUCK

$QQQ Needs this pullback to happen!NASDAQ:QQQ a healthy pullback to fill the GAP and retest the 100/200DMA here going into next week.
A break through these MA's would be very bearish.

$QQQ to $538 then one more leg down?Despite the bearish move in QQQ today, I still think there's another move higher.
I think it's likely that we go and retest the ATHs at $538 (so another 5% or so up) and then we find resistance there and start one last move down to $318-$383.
Only after we see another leg down, do we see new highs. Marked off support levels to the downside.
Invalidation of the idea would be flipping $538 as support.

Smart Entry into the Wheel Using a Credit Put Spread on QQQSmart Entry into the Wheel Strategy Using a Credit Put Spread on QQQ
⚠️ ⚠️ Warning and Disclaimer⚠️⚠️:
This strategy is a trading concept and not financial advice. All traders must conduct their own research and accept full responsibility for the risks involved. While NASDAQ:QQQ is considered a high-quality ETF, options trading always carries the potential for capital loss.
Market Context & Strategic Outlook
Assuming the weekly gap in QQQ gets filled, we may see a temporary correction to around $488 , followed by a quick recovery and potential consolidation near $500 , assuming no new negative catalysts. While I remain skeptical of the market staying perfectly stable, this scenario provides an opportunity for a strategically structured option play with reasonable reward and manageable risk.
If you're planning to acquire 100 shares of QQQ or have the buying power to do so, this strategy can offer a smart and flexible way to enter a long-term position while generating short-term income.
Strategy Concept: Credit Put Spread as Wheel Entry
Prerequisites:
Buying Power: $50,000+
Ideal Market Conditions: Short-term weakness followed by stabilization
Expiration: ~7 Days to Expiry (DTE), depending on volatility and setup
Option Positions Initial Credit Put Spread
Sell QQQ $500 Put
Buy QQQ $498 Put
Net Delta: Less than 0.03
Note: Short strike must be at $500 to set the stage for assignment and wheel initiation.
Management Phases
Stage 1: Entry via Credit Put Spread
- Sell the vertical spread with the intention of owning QQQ.
- If QQQ falls below $500 , close or roll the long $498 put to a lower strike with delta < 0.15.
- Upon expiration:
Let the short put assign, or
Buy the 100 shares outright and close the short leg before the market closes.
Model Virtualization
Alternative (managing risk with rolling down the long put)
Model Virtualization
Goal: Own QQQ at a slightly discounted price, with reduced initial cost due to premium received.
Stage 2: Transition to Covered Call
- After assignment or manual purchase, sell a covered call:
Target DTE ≈ 7 days
Delta ≈ -0.45
Strike price must be ≥ $500
If not available, sell the short call at $500 strike.
Model Virtualization
This generates weekly income while holding the shares, allowing the strategy to compound returns.
Stage 3: Exit or Continue Wheel
- If the call expires worthless, repeat the covered call sale weekly.
- If assigned early, welcome it as it accelerates capital rotation.
- You may also manually unwind the position on expiration if near max profit or market conditions shift.
Model Virtualization
Strategic Rationale
This strategy is a more dynamic and risk-managed version of the traditional Wheel. Rather than starting with a fully cash-secured put, we use a credit put spread for entry, offering a buffer against a steep drop with lower upfront margin.
Why Not Just Sell the Put?
A credit put spread offers:
Defined risk
Lower buying power requirement
Better capital efficiency if the price declines sharply
When NOT to Use This Strategy
If QQQ is expected to trade in a narrow range with minimal volatility, avoid this approach. Instead, consider:
Butterfly or Iron Condor setups with DTE ~12 days
Calendar spreads to benefit from sideways action
Risk and Reward Assessment
Risk and Reward Assessment, Outcome Scenarios
Scenario 1: Price stays above $500
Outcome: Credit put spread expires worthless
Estimated Profit: ~$150
ROI: Approx. 0.3% on $50,000 buying power
Note: No shares are acquired; premium is kept
Scenario 2: Price drops below $500 but recovers
Outcome: Assigned 100 shares, enter covered call phase
Estimated Profit (3 weeks total): ~$800–$1,200
ROI: Approx. 2%
Note: Ideal wheel cycle if managed properly
Scenario 3: Price drops and stays low
Outcome: Maximum loss on the credit put spread
Estimated Profit: -$160
Note: This occurs if the spread expires in-the-money and is unmanaged
This strategy aims not to harvest credit, but to secure a better entry into a long-term equity position.
Caution on Risk
While QQQ is a fundamentally strong ETF, a sharp decline could lock your capital or increase unrealized losses. Liquidity risk which needs that cash for other purposes is the biggest concern.
Mitigation Tip: Consider using a collar strategy (buying protective puts) to hedge against large drawdowns post-assignment.
Stop Loss?
For long-term investors in QQQ, a traditional stop-loss is less critical. But if you're more tactical or capital-sensitive, protecting the downside with a collar is a reasonable move.
Final Thoughts
This approach offers a sophisticated entry into the "Wheel" strategy, additionally, it balances risk, reward, and capital efficiency. Whether the market pulls back or holds steady, you’re either:
Earning premium while staying in cash, or
Entering a high-quality equity position at a better price and generating income weekly.
Thank you for reading. Wish you a successful options trading!

QQQ about to FLUSH?! Let's talk about it!I'm not saying it's over but you have to admit it does feel like we are going to see a decent size pullback...2-6% over the next few weeks on the NASDAQ:QQQ AMEX:SPY
- TVC:VIX back over 20
- US20Y hit 52 week high
- USDJPY starting to creep towards April lows
- $491.54 GAP to fill on NASDAQ:QQQ
- $447.58 Bigger GAP to fill on NASDAQ:QQQ
- Credit starting to become and issue
- Banks/ Credit companies tanked today
There is bullish pieces as well but we do look extended here and a healthy 2-6% would be welcomed...A break of $475 level spells trouble on QQQ.
$QQQ is due for a pullback! GAP fill inboundNASDAQ:QQQ is due for a pullback!
- Slamming into $522ish Volume shelf
- At the red barrier and needs to peel off
- GAP fill down to $491.54
- Strong volume but can't push through $522 resistance

THIS TIME IT'S DIFFERENT!🔥 THIS TIME IT'S DIFFERENT! 🔥
Can you see the shift?! VOLUME IS HERE—AND IT'S MASSIVE. 💪💰
Unlike those weak, fleeting rallies that got crushed under waves of red, this one is packed with bullish buyers and offside hedge funds READY TO SEND IT HIGHER. 🚀📈
Not to mention the last time we had this level of above average volume for this long was in October 2023 when we were coming out of a bear market and it was only the beginning of our ascent higher!
I'm not saying we can't have a pullback soon...I'm just simply saying the volume is here and it looks like dips will indeed be shallow.
ATH retest INBOUND!
Are you positioned for the move? 👀
AMEX:SPY NASDAQ:QQQ

$QQQ // May 19 2026 // Analysis & Targets for Day TradersNASDAQ:QQQ // May 19 2026 // Analysis & Targets for Day Traders

QQQ: Bearish Continuation & Short Trade
QQQ
- Classic bearish pattern
- Our team expects retracement
SUGGESTED TRADE:
Swing Trade
Sell QQQ
Entry - 521.53
Stop - 536.96
Take - 476.43
Our Risk - 1%
Start protection of your profits from lower levels
Disclosure: I am part of Trade Nation's Influencer program and receive a monthly fee for using their TradingView charts in my analysis.
❤️ Please, support our work with like & comment! ❤️

Pullback before higher ? Just looking at a break under from previous lows now that we are back over it right now. 515-505
