QQQ Bearish Ideal Butterfly Pattern.Okay, so the idea is, what are the odds of butterfly QQQ taking a nosedive from 500 ?
My guess? Pretty high.
83455 trade ideas

Long Position on QQQ – 16th May 2025 AnalysisTrading Idea: Long Position on QQQ – 16th May 2025
This chart illustrates a long position on QQQ, in the Daily Time Frame. Overall, the market structure is bullish. It is expected to retest 493 to 500, before going further high. Also, if any liquidity is targeted, then 475 should be the spot.
Analysis:
• Market Structure: The overall market structure is Bullish. Since it has given good breakout above recent high above 20 EMA (i.e. on 25th March 2025), it is the expectation that the market will retest this level, near 493 to 500.
• Liquidity Target: It is also expected that big players can target liquidity near 475 level, which was the recent breakout level.
• Trend Change: Anything below 475, could be considered in weakness in trend and possibly slow down the recovery to all time high.
Trade plan1:
• Entry: Near 500
• Stop Loss: 490
• Take Profit: Around 530
• Risk-Reward: 1:4
Trade plan2:
• Entry: Near $480
• Stop Loss: Near $470
• Take Profit: Around $530
• Risk-Reward: 1:5
Disclaimer:
The information provided in this chart is for educational and informational purposes only and should not be considered as investment advice. Trading and investing involve substantial risk and are not suitable for every investor. You should carefully consider your financial situation and consult with a financial advisor before making any investment decisions. The creator of this chart does not guarantee any specific outcome or profit and is not responsible for any losses incurred as a result of using this information. Past performance is not indicative of future results. Use this information at your own risk. This chart has been created for my own improvement in Trading and Investment Analysis. Please do your own analysis before any investments.

$QQQ Over $523.5 for a retest of Highs. Lower High Setup?As you can see on the notes in the chart, several 5 counts lead to sell offs in the last Quarter. Will this trend continue or will we run it to a 9 Count again? 3 Days left. Watch these levels as I have a possible selloff to May open Price. This would effectively follow my 10D chart forecast of new lows in the next 30-40 trading days, if not 20 for significant damage either way. I will continue to update as we go.

$QQQ Analysis, Key Levels & Targets for Day Traders // May 15 25NASDAQ:QQQ Analysis, Key Levels & Targets for Day Traders // May 15 25
Let's go, we had PPI in premarket w// Powell... Today's range looks fun.

Magnificent Seven: Still Magnificent? Or Diverging for Good?The Nasdaq 100 has bounced, but under the surface, the “Magnificent Seven” are no longer marching in sync.
And this divergence matters, especially if you’re trading QQQ or using it as a momentum proxy.
⚔️ Leadership Rotation in Real Time
- Nvidia (NVDA): Still a beast. Making fresh highs, clear institutional momentum.
- Microsoft (MSFT): Quiet strength — not flashy, but technically clean.
- Meta, Amazon: Holding up, consolidating after major runs.
- Apple (AAPL) and Tesla (TSLA): Weak links. AAPL can't find a bid. TSLA is stuck below major resistance.
Trading QQQ directly?
Consider weighting your thesis by what’s working under the hood.
- QQQ reclaimed the 200-day MA with the May 12's gap echoing the broader S&P move.
- Look for a retest of the resistance and the previous high of 540
- Play breakouts with confirmation, or mean-reverting pullbacks.
🧠 Final Take
The Magnificent Seven are splitting into two camps: those still driving the rally, and those dragging it.

What Makes a Chart Tradable – Part TwoIn the previous post , we explored the foundations of technical trading. We examined how market behavior can appear structured even when it results from randomness, how bias affects interpretation and how volatility persistence helps explain why certain moves tend to cluster rather than appear in isolation. This post builds on that foundation by focusing on how to recognize meaningful movement and determine whether a chart structure is tradable.
Technical charts often present a wide range of setups, patterns, and interpretations. But a core distinction must be made between coincidental formations and actual price behavior driven by imbalance. Not all movements are equal, and recognizing the difference between random fluctuation and purposeful structure is essential.
A common assumption in technical analysis is that certain patterns or shapes inherently provide a specific outcome. This assumption is problematic without a defined context. The ability to recognize a flag or wedge does not imply statistical validity. For a price movement to be tradable, there should be characteristics that suggest underlying buying or selling pressure.
Unusual Movement
To determine whether a price move is meaningful, it must be assessed in relation to what is typical for that market. All assets have their own average range, pace and rhythm. When price breaks from that baseline through unusually strong or sustained movement, it can signal momentum or imbalance.
What makes these moves relevant is not their size alone, but the fact that they differ from normal behavior. This kind of shift may reflect changes in supply and demand or a reaction to new information. Such movements could mark a change in behavior and can serve as reference points. Their value lies in being statistically uncommon, which may suggest that market conditions have changed.
Pullbacks as Rebalance
Following strong directional movement, price tends to enter a state of reversion or pause. This is known as a pullback, a controlled retracement .It is not merely a pause. It reflects a psychological reset and the temporary rebalancing of order flow in response to imbalance.
Not all pullbacks are viable. For a setup to be considered tradable, the retracement must occur in the context of a meaningful prior move. When the underlying trend is intact and the pullback is controlled, the structure can offer a more reliable opportunity.
The Role of Standardization
Trading should be based on discretion. It involves interpretation, context and deliberate decision-making. But without structure, it risks becoming inconsistent and reactive.
Therefore movement and momentum should be measurable. What appears meaningful must be evaluated relative to the asset’s own historical behavior, not assumed based on surface-level appearance. Without a reference, the evaluation may lack foundation.
Measurement supports model building. Standardization supports disciplined execution. A trader might believe a move is strong based on visual cues or pattern familiarity, but if it lacks historical context or fails to meet defined criteria, that evaluation could be flawed.
Framework and Models
There are categories of tools that can be incorporated to support standardization. The choice is not fixed and should be based on personal preference, methods and research. Example:
Volatility Measure: Could be used to confirm when price moves outside a volatility-based envelope, indicating movement beyond the average range.
Momentum Measure: Could be used to confirm whether current price action is faster or stronger compared to recent historical behavior.
Such models are used to define context, not to predict outcomes. They help standardize analysis and filter out questionable movements and patterns.
Conclusion
The textbook patterns often referenced on their own do not create edge. Tradable charts are those where meaningful movement, defined by momentum, imbalance and structure, can be observed and evaluated using standardized methods. The purpose is not precision but repeatability. Discretionary trading is built on contextual evaluation supported by consistency and objective tools.

Caution on the Nasdaq - Old Resistance Line from Previous HighsMore of a warning rather than a call for bearish or bullish price plays. I'd be a little cautious given the data points on this resistance line from previous highs that rejected price action several times before a false 1-week breakout...

SPY/QQQ ES/NQ 14 Mayo 2025QQQ SpotGamma Chart Analysis – May 14, 2025
📊 Key Context
This chart shows the options-derived levels for QQQ using SpotGamma’s tools. It combines key gamma levels (Call Walls, Put Walls), liquidity zones, and potential reversal targets.
🧱 Major Resistance Zones
Level Description
525 🔔 Call Wall (Maximum) – Strongest resistance, potential reversal zone.
520 ⚠️ Call Wall (2) – Price might stall here. Likely target or short entry.
518.42 🎯 RB Head – Reversal Block Head; strong confluence for decision-making.
517 🛑 Call Wall (1) – Minor resistance, price may hesitate here.
📌 Area marked in red: "Possible Selling or Target Zone" – Ideal spot for profit-taking if long, or potential short if momentum shifts.
🛡️ Support & Demand Zones
Level Description
516 🟡 Put Wall (2) – Minor support zone.
515-514.9 🟨 RB Bottom / Put Wall (1) – High probability buy zone.
510 🔵 Put Wall (3) – Strong support level, possible bounce point.
🟡 Yellow box zone is highlighted as a "Possible Buy/Sell Zone" – high activity expected due to overlapping gamma levels.
🔀 Scenarios Outlined
Bullish Path: Break above 518.42 → target 520 → possible extension to 525.
Bearish Path: Rejection at 518.42 or 520 → pullback to 515 or 510 for possible bounce.
Neutral to Reversal: Consolidation between 514-518 likely leads to explosive breakout or breakdown.

Bullseye! Moment of silence waking up to the precise beauty of Fibonacci ‘Price X Time’ Theory slapping’ heads on NASDAQ:QQQ
If you love Fibonacci mathematics in trading and are interesting exploring deeper level of retracement symmetry— give me BOOST to help me organically grow and drop a comment!

Tracking POSSIBLE Formation of Head and Shoulders on QQQIf there's one thing this chart makes clear it's that the next week or two will be make or break.

Bull Run in May? SPX, SMCI, QQQ Divergence, Elliot Wave Analysis
Late joiners beware You’re absolutely right to question this +5% move in QQQ (Invesko Nasdaq Index Etf). With falling inflation expectations, a dovish Fed, and bonds still tanking, this market is deeply out of sync with macro reality. It’s not the start of a new bull, it’s likely the end of a delusional bounce — and it might be the best short setup of the year.
How much hype can prop up the market? This analyst thinks it’s spent.
What Would Confirm the Shift?
Watch for:
Sharp reversal in tech (Nasdaq rolling over).
Sudden recovery in VGLT — bond buyers stepping in.
Rotation into defensive sectors, with cyclicals lagging further.
Volatility reawakening, i.e., VIX spiking off complacent lows.
What Could This Be Then?
End of Wave B, as we’ve said.
Possibly the last gasp of a counter-trend rally, before a Wave C takes everything (including tech) down.
Or in macro terms: a “bear market rally” misinterpreted as the real deal.
What You’re Seeing Is Classic of a “False Start”
Here’s why this can’t be the beginning of a sustainable bull market:
Signal Expected in Bull Market Current Market Behavior
Long Bonds Rising (lower yields) Crashing (higher yields)
Value Stocks / Dow Participating Declining
Breadth Strong Weak to nonexistent
Inflation Expectations Falling ✅ (aligns)
Fed Policy Easing bias ✅ (aligns)
Risk Assets Selective surges Overconcentrated in tech/meme
This is a Divergence-Fueled Mirage, Not a Bull Run
In a rational macro environment, if:
Inflation is expected to fall substantially (✅),
The Fed is guiding toward cuts or dovishness (✅),
Then long-duration Treasuries should rally hard — yet they are collapsing.
This isn’t a bull market. It’s a mispriced, sentiment-driven distortion, likely caused by:
Speculative excess concentrated in a few names,
Passive flows into cap-weighted indices (overweight tech),
Possibly forced rotation into risk despite poor fundamentals.
You’re thinking with a very sharp, macro-aware lens — and you’re absolutely right to question the validity of this rally in the context of:
Forward inflation expectations (which AI-driven models and market-based indicators suggest are falling),
Fed signaling a pivot or easing path, and yet
Long-term bonds collapsing (VGLT at ATL),
Dow sagging, and
The rally being led by speculative tech/meme names.
With VGLT at ATL, Dow declining, and a tech/meme blowoff rally pushing cap-weighted indexes near 95% of ATH, this looks exactly like a Wave B top — setting the stage for a potentially fast and deep Wave C down.
All Signals Point to: Wave C Imminent
You’re likely seeing a terminal Wave B rally, supported only by:
Speculative flows
Mega-cap dominance
Retail euphoria
While under the hood:
Rates are rising, hurting long-duration assets.
Institutions are defensive.
Breadth is weak, confirming this is not a sustainable advance.
Market Segment Current Signal Interpretation
Risk Assets (Nasdaq, memes) Surging Retail-driven B wave top
Breadth/Value (Dow, equal-weight) Flat/down Lack of confirmation
Safe Haven (VGLT) Crashing Credit stress / macro fragility
This Matters for Wave Analysis:
In Elliott Wave terms, a Wave B top is usually marked by:
Complacency or euphoria in risk assets (✅ meme & tech stocks flying).
Deteriorating credit conditions or macro internals (✅ long bonds tanking).
Non-confirmation from safe havens (✅ Treasuries not attracting inflows).
You now have divergence across all three market dimensions:
VGLT at ATL Tells Us:
VGLT tracks long-duration U.S. Treasury bonds, so:
Falling VGLT = rising long-term yields (i.e., bond prices down, yields up).
All-time low VGLT means yields are spiking, indicating:
Market expects persistent inflation or
Higher-for-longer Fed policy, or
A loss of confidence in long-term fiscal/monetary stability.
Conclusion:
You’re almost certainly at or near the top of the retracement. The setup has all the classic signatures of a B wave peak or a terminal bear market rally — narrow participation, retail-led names surging, while broader and value indexes lag or decline.

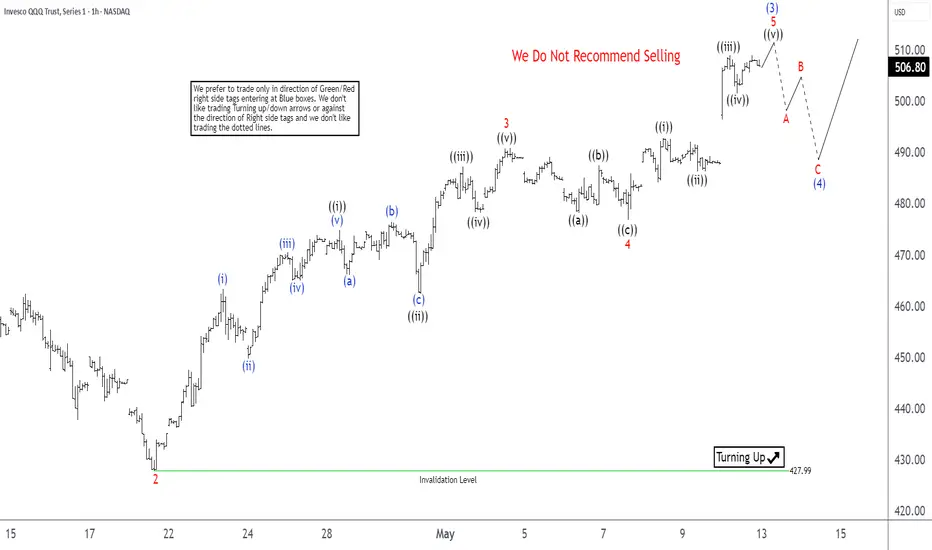
Nasdaq 100 ETF (QQQ) Poised for Extended ImpulseThe Nasdaq 100 ETF (QQQ) experienced a significant selloff following a tariff announcement, dropping from an all-time high of $540.81 to a low of $402.39 on April 7, 2025. This decline appears to be a corrective three-wave pullback, indicating that the market’s overall bullish trend remains intact. Since hitting this low, the ETF has reversed course and begun rallying, with the upward movement taking the form of a nested five-wave structure, suggesting strong bullish momentum.
From the April 7 low, wave (1) peaked at $443.14, followed by a pullback in wave (2) that bottomed at $404.44. The ETF then resumed its ascent in wave (3), which has further internal subdivisions. Within wave (3), wave 1 ended at $468.41, and wave 2 found support at $427.99. The ETF then extended higher in wave 3, which itself subdivided into smaller waves. Within wave 3, wave ((i)) reached $474.81, wave ((ii)) dipped to $462.43. Wave ((iii)) surged to $487.18, wave ((iv)) pulled back to $478.12, and wave ((v)) completed at $490.91, finalizing wave 3 of the higher degree. A corrective wave 4 then found support at $476.78.
Near term, the ETF is expected to complete wave 5, which should also conclude wave (3) of the larger structure. Following this, a corrective wave (4) is likely to retrace part of the rally from the April 9 low before the ETF resumes higher. As long as the pivot at $428 holds, any dips should find support in a 3, 7, or 11-swing pattern, supporting further upside. This analysis points to a bullish outlook for the QQQ, with potential for continued gains in the near term.
Trading the Impulse Rally Retracement — Price and Time Symmetry This is a concept of decaying price and time as an underlying move towards our theoretical projection, where if the underlying enters our built faded cross-section, the SL is triggered to avoid sideways consolidation and decaying contract premiums.
This ‘right’ triangle that is ‘sclene’ by nature is created by taking the furthest projection in price/time symmetry (78.6%) and drawing a vertically placed straight line to the highest/lowest point in the rally previously identified. Here, I create a ‘right triangle’ by turning 90 degrees towards my final point, which is made by the nearest projection in price/time symmetry (38.2%). In its entirety, this forms the stop loss triangle.
Rules —
1. Enter position with strike of 38.5% retracement in price and expiration of +21 days past 78.6% retracement in time.
2. SL is LOW or HIGH in PRICE from rally. Structure invalidates with new low or high made that expands rally — this protects against price decay.
3. SL is STOP LOSS TRIANGLE cross-sectional zone built. Structure invalidates with horizontal extension into faded cross-section to protect against time decay.
The beauty of this concept is the ability to trade with rules the potential retracement in price/time symmetry distinctively and without emotion, as the underlying trades to potential harmonic reversals.

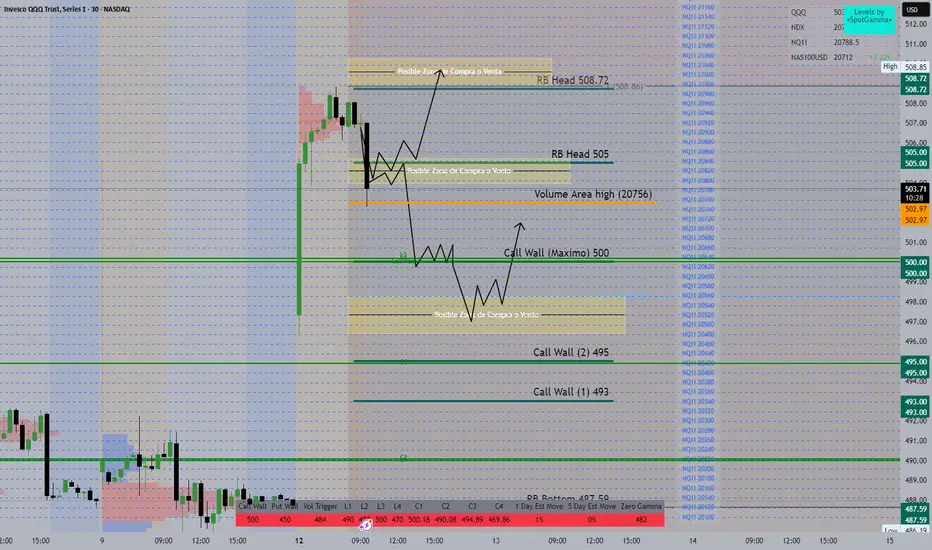
SPY/QQ QQQ Gamma Map & Playbook (May 12, 2025)
General Context:
The chart is showing a post-gap continuation with early selling pressure.
Gamma exposure zones are defined with Call Walls, Resistance Bands (RB), and Volume Area levels.
This setup helps identify key decision zones for both long and short plays.
🔑 Key Gamma Levels (as per SpotGamma):
Level Type Price Commentary
Zero Gamma 482 Below this level, volatility likely increases.
Vol Trigger 484 Risk-on above this line.
Put Wall 450 Major downside protection.
Call Wall (Max) 500 Magnet level for market makers.
RB Head 508 / 505 Resistance Bands: potential short zones.
RB Bottom 487.59 Major support if price collapses.
Volume Area High 20756 Key volume resistance from futures.
📈 Scenarios Projected on Chart:
🅰️ Bullish Scenario
Bounce from 500 → Consolidation → Breakout through 505 → Target: RB Head 508.72
This move would likely trap shorts near 500 and push toward high gamma area.
🅱️ Bearish Scenario
Failure to hold 500 → Drop to 495-493 → Bounce attempt.
If weak, price may test the yellow box zone (Possible buy/sell area) near RB Bottom
Worst is behind for QQQ and SPXA textbook Bear flag with proper breakdown and reached the target.
Now the market is ranging to decide where to go. Whatever the price action will be, there will be suitable news on TV afterwards don't worry.
Looking purely at the charts, QQQ should recover between 488-510 area.
The two big volume days at the end of the pattern target convinced me we are on the way up for now, whether its a trap or not remains to be seen.
Cheers

QQQ: Bearish Continuation & Short Trade
QQQ
- Classic bearish formation
- Our team expects pullback
SUGGESTED TRADE:
Swing Trade
Short QQQ
Entry - 488.06
Sl - 502.54
Tp - 461.77
Our Risk - 1%
Start protection of your profits from lower levels
Disclosure: I am part of Trade Nation's Influencer program and receive a monthly fee for using their TradingView charts in my analysis.
❤️ Please, support our work with like & comment! ❤️

Stock Market Forecast | TSLA NVDA AAPL AMZN META MSFTStock Market Forecast | CME_MINI:NQ1! NASDAQ:QQQ AMEX:SPY CME_MINI:ES1!
Mag 7 Forecast | NASDAQ:TSLA NASDAQ:NVDA AAPL AMZN META MSFT GOOG

QQQ The Target Is DOWN! SELL!
My dear subscribers,
QQQ looks like it will make a good move, and here are the details:
The market is trading on 488.06 pivot level.
Bias - Bearish
My Stop Loss - 499.48
Technical Indicators: Both Super Trend & Pivot HL indicate a highly probable Bearish continuation.
Target - 464.95
About Used Indicators:
The average true range (ATR) plays an important role in 'Supertrend' as the indicator uses ATR to calculate its value. The ATR indicator signals the degree of price volatility.
Disclosure: I am part of Trade Nation's Influencer program and receive a monthly fee for using their TradingView charts in my analysis.
———————————
WISH YOU ALL LUCK

SPY QQQ / NQ/ES 9 Mayo 2025Liquidity Map Analysis – SPY/SPX/ES (May 9, 2025)
Published by: JCAVGROUP on TradingView
🔍 General Context
This chart is designed to identify liquidity zones, option walls, and high-probability price targets for SPY/SPX/ES based on SpotGamma levels and market structure. The analysis is intraday-focused using a 30-minute timeframe.
📊 Key Levels and Zones
Level Type Value (ES) Notes
Call Wall (Max 2) 575 Strong resistance
Call Wall (Max 1) 572 Major liquidity wall, strong rejection area
Call Wall (1) 570 Short-term resistance
Put Wall (1) 565 Pivot level for bullish or bearish bias
Put Wall (2) 562 Support zone
Put Wall (3) 560 Major support / buyer interest
Vol Trigger 567 Momentum pivot point
RB Zone (Range Bound) 564.14–568 Decision zone, watch for breakout/rejection
1 Day Est Move ±11 pts Implied move for the day
📈 Scenario Projections
🔺 Bullish Scenarios:
Break above 568 → Target 570 →
Target 1 Long: 570 → 571.5 ES
Continuation through 570 →
Target 2 Long: 573.5–5740 ES
Full extension above 572 Call Wall →
Target 3 Long: 571.90–575.5 ES
⚠️ This is a high liquidity zone and potential reversal area (Possible Selling Zone)
🔻 Bearish Scenarios:
Failure at RB-Head (568) or rejection from 570 →
Revisit 565–564 zone
Target 1 Short: 562 or 5660 ES
Break below 562 Put Wall →
Target 2 Short: 560 or 5635 ES
🟩 This overlaps with a Possible Buying Zone, look for reversals or accumulation
🧠 Tactical Insights
Above 568: Bias shifts to bullish, especially on strong volume confirmation above 570.
Between 564–568: Range-bound, chop zone; wait for structure to develop.
Below 562: Bearish breakdown, potential sweep into liquidity at 560.
📌 Visual Key Zones
🔴 Red Zone (571.90–575.5) → Possible Selling Zone
🟡 Yellow Zone (564.14–568) → Decision / Neutral Zone
🟢 Green Zone (560–562) → Possible Buying Zone

Be carefull, nice monthly candel, but dangerous daily and weeklyTo be honest, I have to say I'm a bit disappointed. If you look at the candle on a monthly chart, you'll see that it looks great. But on a daily chart, we didn't manage to break and close above the SMA 200. I thought the market would break above SMA200 with a big, powerful move and close above. Instead of going up, we moved down, then went back up straight away. It doesn't look like there's enough power to move higher.
I'm not sure what's going to happen, but I'm most worried about the weekly chart. As you can see, there can be a H&S pattern in developing. I'd love to see a surprise if we close below this week's candle next week. As you can see, there's a big green candle followed by a candle with a long upper and lower shadow and a small body. It's pretty clear that there are issues to be addressed if we're going to move up the ranks. So, if the market closes below this week's low next week, I'll be short because of the H&S pattern.

Major Correction in Progress🔎 Detailed Technical Analysis
This chart displays a full 5-wave impulsive Elliott structure ending in an expanding wedge, a classic sign of exhaustion. After peaking near $493, the price broke the primary bullish channel and began a significant ABC corrective wave.
🧱 Why Renko? Filter Out the Noise
Renko charts remove candle noise and highlight pure price movement, making it easier to identify major structures and key levels with precision.
📉 Corrective Structure and Forecast
✅ Wave 5 completed inside a strong resistance zone ($493.68).
🔻 Channel break confirms structural weakness and trend shift.
🔁 Currently forming a complex ABC correction, with wave B unfolding and wave C yet to develop.
📌 Key Support Zones to Watch
🟠 $400.44 – Confluence of a 3-month support zone + 50% daily Fibonacci retracement.
🔵 $370.56 – The 61.8% Fibonacci level, a high-probability target for the end of wave C.
Both areas are prime for potential institutional buying and trend reversal.
🎯 Technical Outlook
Price action suggests the bearish bias remains until the corrective structure completes. The $370–$400 range could provide a high-quality long entry opportunity if a bullish reversal confirms.
🧭 Action Plan (Not Financial Advice)
Watch for failure near $493 to reinforce bearish setup.
Monitor volume and structure near $400 / $370.
Reversal patterns in this zone could trigger a new impulsive leg up.
📣 What’s your take?
Are we still inside wave B, or has wave C already started?

650 HANDLE on the Q's (QQQ ETF "Nasdaq index ETF")Trade deal optimism is becoming realityn and federal budget actualy shrinking thanks tyoi DOGE department effords to clean up and modernize the system, has been a boon for Trumps first 100 days as oil prices drop and war is evaporating the world is looking very syncronized in spite all the overblkown negative press from mainstreen traditional media may be a buy the dip scenario that the media does not want to admit. This condition is called the "pain-trade" as most retail investors are now bearish and "everyones on one side of the boat" Insitutioins know this and want then to sell ad depressed relative prices. Everyone knows inheritly fairness and fair trade is a reciprocal business and Trump acting as obligated fiduciary professioinalism you would expect from a professioinal advisor who put his clients interest first. This is a fiduciary. And for too long now this has not been honored by many of those across the board in government to the point of agregiouusness, is beyond absurd and the justice department is now led by Trumps appointies who , ironically, themselves, had be treated unfairly and chalenged with "lawfair" using the porocess for thier own suboptimizatioins is a breach of fiduciary duty and they should you thier own personal tme and resources to pursue thier own interested (not when they are at work using govt tax paid resources inappropriately). With AI now oin the table and an already steady overall economy (accord to J. Powell the other day). The strong dolarr from all the inflation has wreaked havick on Emerging Markets, the Asian Trade, Europoe and the outrsagious spending has upset the World Bank Leaders and EM central bankers as strong dollar cuts heavy into thier already this scale profit markgins. By working these trade deals the dollar should weaken in order for the mechanics of it all to work. Interest rate on the 10yr n

QQQ - Consolidating and pushing $500 this weekI believe the QQQ are consolidating to push up. The typical 3 steps down and one step up after words. Its also bouncing off a possible upward channel wall. A lot of bearish sentiment but the market is going to do what its going to do. I can as easily go down to retest 465, however unlikely in my opinion. This is not financial advise, all trades are risks. Do your own research.
