$QQQ APRIL 28 2025NASDAQ:QQQ APRIL 28 2025
Nothing about this trading range looks easy. Look at that!!
83455 trade ideas

QQQ: Bearish Continuation is Expected! Here is Why:
Our strategy, polished by years of trial and error has helped us identify what seems to be a great trading opportunity and we are here to share it with you as the time is ripe for us to sell QQQ.
Disclosure: I am part of Trade Nation's Influencer program and receive a monthly fee for using their TradingView charts in my analysis.
❤️ Please, support our work with like & comment! ❤️

QQQ Bullish LongLooking for the predictions, We have multiple good news coming forward
Earnings Session
Tariff pause on china
Japan Trade deal
China Trade Deal
Rate cuts
QQQ - Your guess is as good as mineMarkets are all over the place. I know ground breaking info. I don't think there is any clear answer to what is next.
Even if Trump does reduce tariffs on China, they are still going to be some of the highest in recent history. However, it looks like Trump has flinched and China has the upper hand. That is just likely going to make Trump more erratic since his policies are emotional/ego driven and not strategic.
Overall, there are likely some short-term gains to be have as the market likes to always push up when not in an panic sell. For now, the worst of the news is over and the low from the other week is likely going to be the bottom for the near future. I expect stock to continue this up and down until the tariffs work there way through the system and we see the true effect on the economy.
We punched above the 20 day SMA yesterday and will likely test it for support today and tomorrow. If it holds, I wouldn't be surprised to see prices test the 200 day. Hard to know what crazy stuff Trump will do over the weekend, so we will have to see. Good luck and enjoy the ride.
The Graveyard Of Hope!The Graveyard of Hope is littered with "Buy The Dippers."
How many times can "Buy The Dippers" lick the stove before they finally learn their lesson not to believe anything Trumpchenko says?
The Elona MAGA algorithm goes like this
Over promise
Under deliver
Lie
Declare victory
Leave or Victim Blame
Meanwhile, the economy falls into an economic recession/depression abyss!
I am A political. I call it as I see it. My religion is Economics, Charts, and money. They don't lie!
Click Boost, follow, and subscribe. Let's get to 5,000 followers so I can help more people navigate these crazy markets.
Don't smoke the hopium crackpipe. It will financially ruin you.

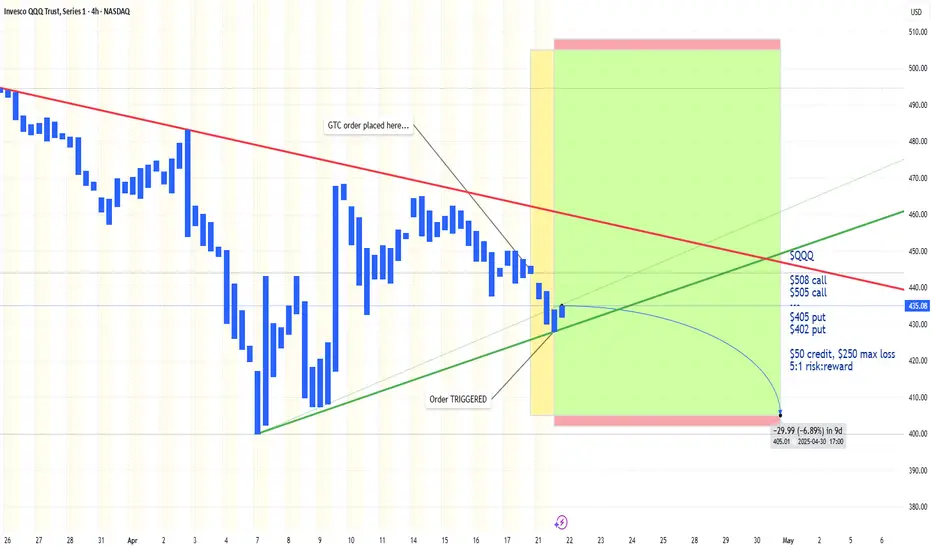
Short Iron Condor, 7 Days till ExpirationNASDAQ:QQQ
+1 $508 call
-1 $505 call
---
-1 $405 put
+1 $402 put
4/30 Expiration (WED)
$50 credit, $250 max loss
5:1 risk:reward
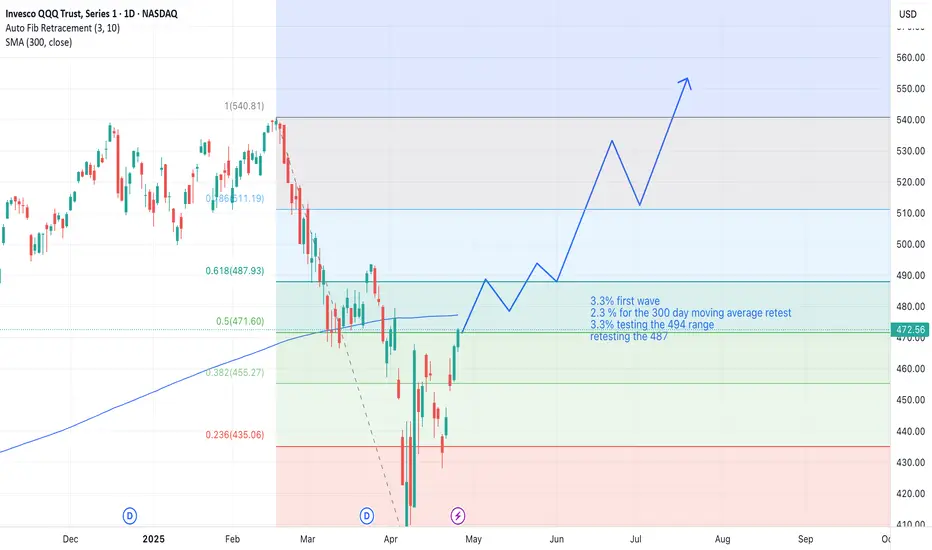
Key Test of Resistance on QQQKey remount of the QQQ. We are over the 9ema and 20sma now and testing a huge supply zone that we need to eat thorugh. This ownt be easy as this 470 level is a huge supply but this can be the start of something. A couple days of chop here while we grind under the supply zone could set us up for higher prices. They key is to see how we react into this zone as the first test into that 470 we might get rejected in absence of news but we need the see the nature and structure of that pullback. We are by no way means out of the bear market this is a traders market but there are some green shoots. The market is shrugging off bad news and the trump team is trying to keep this market afloat by anymeans!

QQQ Ready to Rip Higher? Gamma Pressure + SMC Confirmation Align 🚀
QQQ is showing strong signs of continuation as we head into the next session. Let's break it down using both Options GEX sentiment and Smart Money Concepts (SMC) structure.
🔍 GEX Outlook (Options Sentiment)
* Highest positive NETGEX sits at the 445–448 range, acting as a magnet.
* We’ve already reclaimed the HVL support at 430, and the Options Oscillator is lighting up bullish.
* Calls make up 26.9% of the flow and GEX flipped full green, meaning market makers are likely long gamma — pushing price toward resistance.
* Resistance clusters:
* 445–448: GEX9 and 2nd Call Wall.
* 466.35 & 479.02: Target zones from price action.
💡 Options Trade Idea:
445C or 450C (0DTE–2DTE) — scalp toward the GEX magnet zone.
460C+ (Next Week) — swing if price holds above 447.8 and you want to play the extension to 466–479 range.
📈 Technical Analysis (SMC + Structure)
* MTF trend bias: 30m & 1h bullish.
* Strong bullish structure with ChoCH → BOS → rally confirmation.
* Thin volume during this leg up is a cautionary flag — be selective with entries.
* Price must hold above 447.8 to remain in bullish continuation.
* If volume steps in, this could be a session high sweep with fuel left.
* Setup: Bullish Hold
* Entry: Await confirmation near 447.8 zone.
* Target 1: 466.35
* Target 2: 479.02
* Stop: Below 441.01
🧠 My Thoughts:
This looks like a textbook GEX compression + SMC breakout alignment. MM positioning is bullish and technicals are lining up with a classic continuation pattern. However, thin volume could mean a stall or trap — I’d stay nimble, scale in on dips, and tighten stops once we push into the 455–460 zone.

QQQ APRIL 22 2025Today's Trading Range and we also have TSLA Earnings in afterhours and the implied move for that was in today's video.

Head and Shoulders on QQQ ConfirmedBeen tracking the possible formation of this pattern for a while. It's confirmed as of today.

$QQQ - Headed for the Next Leg DownNASDAQ:QQQ - Headed for the Next Leg Down
Bearish Wedge broke down today!
Measured Move: $377.15
Measured Timeframe: 06May
Below my H5_D Indicator and the Wr% is in motion down to the Green Barrier.
All signs are pointing LOWER!
Not Financial Advice

Short term high QQQ tgt $434I had a great day with dowsing the highs & lows on QQQ today, and since hitting this high, I asked what's next & keep getting breakdown.
I did a week by week reading at the beginning of the month, and this week is supposed to take a bit of a dive & be "bottoming out". The weekly readings have been pretty helpful, so I hope this continues.
Anyway, this could be absolutely incorrect, but twice I've gotten a move to the downside on QQQ of around 5.6-.7%.
I also got some figures lower, but I'm not confident they are prices. They were 425-22. Sometimes numbers come that are something other than what I ask or expect, so it can get confusing. It's possible there's another little pop first, but It seems like a drop is imminent according to my work. Watch for a low on Wed./Thurs? I have lots of dates for this week including for a high today.

QQQ, Weekly RSI has reached oversold territory just 4 other timeIt's also came at or near a long-term bottom.
If you're a long-biased trader looking for high-probability entries, this setup deserves your attention.
The weekly RSI just hit oversold territory — something that’s only happened 4 times in the last 10 years. Each of those times? It marked a major bottom or the start of a strong bullish trend.
We’re also bouncing near long-term horizontal support (~$420) and holding above a rising trendline that’s defined the bull market since 2018.
If price continues to hold this zone and RSI starts curling back up, I’ll be looking to go long.
Stop below $420. Reward-to-risk looks solid if momentum confirms.
Not calling the exact bottom — just positioning where the risk makes sense.

$QQQ - Recap of Last Week April 14-17
Last week we had a shortened Trading week because of Good Friday.
We opened the week with a gap up and got a rejection at the 30min 200MA.
++ You typically don’t want to go long at a downward facing moving average. ++
And this did play out all week. We got rejected at the downward facing 200MA on Monday, again on Tuesday.
On Wednesday we gapped down (UHC weighed on the market). Wednesday we had a big down day - closing down almost 3%
And then on Thursday we came back up but stayed underneath the 35EMA.
Thursday was the last day of the trading week, and look tat the setup we started the day with. Red 35EMA trading under the Blue 30min 200 (That was bearish)
30min 200 pointing down - that was bearish. And bear gap at the top of the implied move.

QQQ SHORT @ $448 TO $433Price also happens to be at the 60% fib level which is added confluence. Will most likely cut this trade around $435 just to secure profit and so I don't have to hold as long. If it decides to crash then of course ill hold. stop loss no higher than $450.7


Sit back , wait then StrikeGood afternoon as of 13:35 P.m. It is a bumpy low movement. Possibly in an accumulation phase good time for buy-hold over two week span. Tomorrow the market is closed. A spike might jump before 16:00 P.m. Average in during that phase, for optimum position

$QQQ - BOOM hit the bottom of the trading range here
That was awesome!! I had spreads here at the bottom 3 dollar wide 442/439 which filled end of day before swinging back in.

QQQ - Intraday Setup April 16 2025QQQ Intraday Setup
April 16 2025
Decision making - 15minutes time frame
Short trade scenario -1
Market Takes resistance = 455.95
Stop loss = 456
Short trade get initiated
1st Target = 449.0 (profit booking)
2nd target = 442.58
Trade setup explained:
Market made a high of 455.95 on April 11 2025.
High has sustained above 455.95 in next 2 trading sessions
Market has opened today below 455.95. Hence this support zone is now intraday resistance zone.
Long trade scenario-1
Market Takes Support = 442.58
Long trade gets initiated
Stop loss = 441.20
1st Target 450.85 (Profit booking)
2nd Target = 455.95
Trade setup explained:
Market made a high of 442.58 on April 7 2025.
Market has sustained above 455.95 in next 6 trading sessions until today and hence becomes intraday support.
Long trade scenario-2
Market opens gap down and sustains above = 450.85
Long trade gets initiated
Stop loss = 447.19
1st Target 452.64
2nd Target = 455.95 (Profit booking)
Trade setup explained:
Market has a downward trend on April 10th and creates an intraday swing high of 450.85. The swing high of a downward trending day becomes 1st stage of resistance when markets are close to this price.
Disclaimer: I am not a registered analyst. The above information is only for educational purpose based on my years of experience. Please consult a financial advisor before investing.

QQQ Breakdown Incoming? Gamma Pressure Exploding at 452 🔮 GEX (Gamma Exposure) – Options Sentiment Overview
🔥 PUT Dominance at 452 – Market on the Edge
* QQQ is trading directly at the highest negative NET GEX level at 452.31, marking it as the PUT trigger zone.
* A breakdown below 452 opens the gates toward 450, where the 2nd PUT Wall (-13.23%) adds further downside acceleration.
* This is a high-risk gamma zone: dealers are short gamma and could fuel a liquidation flush if price stays under 452.
🧱 CALL Walls Stack from 456–463
* The nearest CALL resistance zone sits between 456–458, topped by 461–463, all stacked with hedging activity.
* Strongest net positive GEX (gamma ceiling) sits around 458–460, aligning with macro rejection zones.
📊 Options Sentiment Snapshot:
* IVR: 46.7 → Moderate volatility, but still supportive of fast swings.
* IVx avg: 34.8, down –11.25%, showing vol is compressing while risk increases — dangerous combo.
* PUTs 67.6% → Overwhelmingly PUT-heavy environment, a signal of dealer short gamma pressure — one move down can feed the next.
🎯 GEX Implications:
* Break below 452 → Expect momentum to ramp toward 450 → 448 → 440 range.
* Bounce off 452 → Needs strong reclaim of 456–458 to reverse gamma flow — very difficult without macro help.
🕰️ 1-Hour Technical Analysis
Structure:
* QQQ broke down from an ascending wedge and is now retesting prior support at 452.47.
* Price is below all EMAs and losing VWAP — confirms bearish control.
Indicators:
* MACD: Weak and diverging bearishly — no sign of reversal strength.
* RSI: Dipping under 40, near oversold, but no bullish divergence visible yet.
Key Levels to Watch:
* Support: 452 → 450 → 448 → 440
* Resistance: 456 → 458 → 464.98
🧠 Final Thoughts:
QQQ is sitting on the edge of a gamma trap at 452. With PUTs dominant and technicals confirming weakness, there’s a real risk of continued slide toward 450–448 or lower if bulls can’t reclaim the 456 zone quickly.
GEX suggests heavy dealer hedging is active — so expect volatility, and prepare for a momentum spike if 452 fails.
This is not financial advice. Always trade with risk management, and let price action confirm your plan before executing.

This is a good spot to start buying the market.We’ve reached the lower boundary—whether this marks the start of a prolonged sell-off or a rebound point doesn’t matter right now. In the next couple of weeks, we’ll trade higher before the true extent of the damage becomes clear. This is a good spot to start buying the market.

$QQQ - Recap of April 14 2025Today, Monday April 14th we opened with a gap UP to the 30min 200MA and slightly above that. We closed the top of the gap (always a potential resistance and in the case here, paired with the 30min 200MA that was facing down we did get pulled back down to close the morning gap and the rest of the bear gap (combined it was an island gap)
Once we closed the bear gap first from above we came back and closed the bull gap, we took another swing at the 30min 200, still facing down and got rejected back down into close. It was an easy trading range today. Rather predicable, in my opinion, with the downward facing 30min 200MA, the bear gap and the 35EMA still trading underneath the 30min 200MA. These are all things I drill in daily in the videos and even though we closed great a lot of the bearishness of this chart today played out to contain the upside.
Also let's not forget that we had a green signal line today!! It looked weak but you can see the support, weak or not, it stayed green.
How did you guys do??

Bullish Setup for QQQ: Price Targets and Key Levels for Next Wee
- Key Insights: QQQ exhibits strong bullish momentum, supported by technical
setups, including cup-and-handle formations and golden crosses. Buyer
sentiment remains robust, driven by tariff pauses on tech and chip stocks
and a broader recovery in indices. Sustaining above key support at 444 will
be critical for maintaining upward momentum, while geopolitical volatility
should be monitored closely.
- Price Targets:
- Next Week Targets: T1 = 465, T2 = 478
- Stop Levels: S1 = 436, S2 = 421
- Recent Performance: QQQ has rallied 7.5% in its latest bullish phase and is
currently trading at 446.18, outperforming major indices like SPY and ES.
Short-term activity reveals consistent gains above last week’s and
yesterday’s closing prices, underscoring the strength of buyer sentiment.
- Expert Analysis: Technical indicators such as stochastic oscillators, golden
crosses, and Fibonacci levels point toward sustained upside potential.
However, experts urge caution due to heightened geopolitical risks and
inflation concerns. Price action around the 444 support level will validate
the reliability of QQQ's bullish case.
- News Impact: Positive catalysts include a tariff pause on tech and
semiconductor stocks, which benefits QQQ’s key holdings in the technology
sector. Additionally, broad market recovery and renewed optimism have
amplified fund flows into the NASDAQ 100. However, potential downside risks
stem from trade tensions and inflationary pressures, making QQQ vulnerable
to sudden volatility despite its promising technical structure.
