7/31 QQQ ATR Levels and RangeNo comments, just watching. I think today is a "whatever the fudge happens" kind of day.
Good luck all, I am watching these lines based on Volume, Price action and ATR Levels being respected.
9455 trade ideas

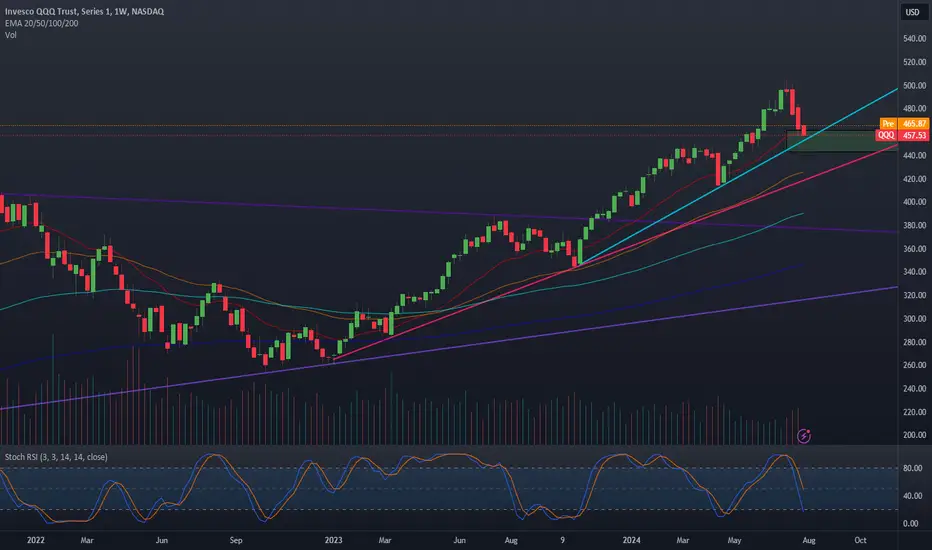
QQQ hits first downside targetQQQ hits the first downside target of 460$ and falls into the weekly demand zone as we suspected for weeks. MSFT, META, AAPL and AMZN earnings will decide where we go from here, we have been receiving mixed sentiment on large caps with AMD pumping and MSFT dumping. I suspect we fall a bit deeper into this demand. If we do we lose the teal momentum line and fall to the red which is still reasonable with 3 macro touchpoints.
-We have already seen a 10% correction, I think we might wick a bit lower but I see buyers stepping in already
-There is a very low chance we dont continue to pump into elections
Main Focus List Review 7-31-24Going over our Main focus list RTH looking for clues trying to setup a consistent process and growing 1% every day. our only goal is to be better than yesterday.

Wow $QQQ $SPY etc. Bulls might be in serious trouble now! Big sell off in the markets today, and especially right after close! Pushed below major support and trend lines. Market looks super bearish to me now, I don't see another bounce possible for bullish continuation, from here.

QQQ Bearish Pennant forming on 30m chart?I'm just charting this out to keep and eye out. I feel QQQ is due for a good bit more of downside and may be in a short term bearish trend. I am very new to charting and just testing out what I see. GLTA

QQQ - Bearish Trend Change But Bulls Eyeing Bounce?Today we had a bearish trend change on the Daily. This is significant given the last bearish change occurred back in April '24. The bears can't celebrate just yet as we are sitting on our long term EMAs but bears will have an opportunity to defend shortly. I'm keeping an eye on our RSI possibly going to retest our downward sloping RSI moving average around the 50 mark. This is significant if we see a pullback in the bearish daily trend. If you have missed this short move down, a pullback in our bear trend reading is your best r/r to take a shot. Markets are starting to get loose!

End of correction?Looking at the chart for the Invesco QQQ Trust, I can see a potential bullish harami pattern near the end of the price action.
This formation matches the description of a bullish harami pattern as shown in the informational image:
- It's a 2-candle pattern
- The first candle is a long red one
- The second is a smaller green candle
- The second candle is contained within the body of the first
This pattern suggests a potential short-term reversal from the downtrend to an uptrend. According to the information provided, this could be used as a signal to buy stocks or add to existing positions.
However, it's important to note that while this pattern is present, traders should always consider other technical indicators and fundamental analyses before making trading decisions. The effectiveness of any single pattern can vary depending on market conditions and other factors.

ADX with changed colors and thickening of the ADX lineCreative ADX where I changed the colors. ADX with changed colors and thickening of the ADX line

Monday Consolidation? / Chop before strong move on Tuesday?I'm going to be paying attention to price action throughout monday and see if I catch a swing within this pennant and see if it gives an indication for where we move on tuesday. All subject to change with any earnings or news of course. glta

.5 Fib Level on QQQ worth keeping an eye out onI'm keeping an eye out on if this bounce off the .5 Fib Level on QQQ is going to retest to go lower or consolidate around here

QQQ - Strong wave up incoming (BULLISH)Strong wave up incoming - likely NASDAQ:QQQ will shoot up towards end of the year with rate cuts incoming and it being an election year, plus technical-wise it has pulled back quite a bit and due for a wave up

QQQ: Will Start Growing! Here is Why:
Remember that we can not, and should not impose our will on the market but rather listen to its whims and make profit by following it. And thus shall be done today on the QQQ pair which is likely to be pushed up by the bulls so we will buy!
❤️ Please, support our work with like & comment! ❤️

QQQ Massive Long! BUY!
My dear followers,
This is my opinion on the QQQ next move:
The asset is approaching an important pivot point 463.00
Bias - Bullish
Safe Stop Loss - 454.70
Technical Indicators: Supper Trend generates a clear long signal while Pivot Point HL is currently determining the overall Bullish trend of the market.
Goal - 475.34
About Used Indicators:
For more efficient signals, super-trend is used in combination with other indicators like Pivot Points.
———————————
WISH YOU ALL LUCK

QQQ --- AI Tech Bubble Keeps GrowingRight now, not much seems to be stopping the bubble in Tech. You can see we broke above resistance on June 11th and have not looked back. I was expecting some form of test of support, like back in July 2020, but instead any pullback has been bought up. Volume is low and that means that everyone is long to go along for the ride. If we get a run up like back in August 2020, we could top out at the $550 range.
We are in the region of extra hard to predict what will happen next. Without a clear reason to sell, this can keep going. I would expect to see some form of profit taking that could make for a bigger pullback, but so far nothing. I think the saying "The Market Can Remain Irrational Longer Than You Can Remain Solvent" comes to mind.
I am curious if we are in for a case of "buy the rumor, sell the news" when it comes to interest rate cuts. Maybe this will keep going up until we actually get a rate cut.
1D


QQQ Intraday $100 to $2500 with options RECAPQQQ is shown here on the 15 minute time frame. Overlaid are a HMA 7 and SMA 5 to provide
moving average crosses. QQQ made a "M" pattern. Options charts are shown in the updates.
First Trade SQQQ is opened at 9:48 for $ 6.00 per call contract times 16 contracts. It is closed
at 10:05 less than 20 minutes later at $20.00 per contract. $96 dollars the only risk in the trade
is waiting to settle as is the $ 224.00 in profit. ( This is a same day expiration intraday trade)
Second Trade QQQ as QQQ has topped and is pivoting down. The second trade of the day
is not a same day expiration as it is now Friday afternoon, a put option in the direction of the
trend is taken for Tuesday the 20th, there being no puts for the Monday holiday.
The floating profit is $ 224 and the strike is set for below the money in the current direction of
the trend. A strike of $ 429 selected. The options chart is shown in the updates.
The premium was 0.37 so $37 per contract so six contracts were taken for a total of
which is $222 or slightly less than the profit on the first trade. The trade is taken at 14:47
market time and closed about 90 minutes later at 15:52 before the close.
The contracts sold at close for $ 1.41 each yielding $ 141 per contract or $ 2256 overall.
Between the two trades $100 was risked and $ 233 + 2256 or 2489 overall.
The Reward to Risk ratio was about 25. The profit and the initial $100 into the trades
awaits settlement after the holiday.
This trade was made to teach a mentee about the power of options leveraged with narrow
expirations to optimize profits and not spend a lot of time in the trade to minimize risk
in the market from any number of potentials. Alerts and notifications centered on moving
averages and rise or fall of intraday low time frame relative strength are used to lessen
screen time. Twenty baggers may not be everyday but then again with practice and patience
they can come along often enough.

QQQ rangbound bearish bias SHORTQQQ on the daily chart hit a hpivot high on 3/21 followed by a slight downtrend of 1-1.5 %
overall this past week. Buying volumes are low. The Price Momentum Oscillator has
reversed to bearish and the Raltive Trend Index has entered the chop zone and is heading
bearish. Price is presently one standard deviation above the intermediate-term anchored
VWAP. Reversion to the mean suggests another 1% move downside before VWAP support
exerts itself. Price is compressing in a symmetrical triangle. Accordingly, I am expecting
a move down before a potential reversal in a VWAP bounce from that support.

CRASH!?Potential 20% further downdraw from here. When you have a well defined channel and you break above and fail. There is good odds you will test the other side of the channel. Not saying it will happen but it is something I am preparing for. The groundwork is there with potential rate cuts (Historically bearish) and recession fears acting as a potential catalyst in the coming weeks/months. That being said there will be opportunities to buy the dip here and if you DCA the end of the week should be a good time to start

I am a buyer on new lows 473/470The chart posted is the QQQ I sold all longs yesterday into the 483.8 as we formed a abc x abc into fib relationship The drop is that of two wave counts first is a wave B low today in the 473 area or wave 5 to a target 470.8 both wave counts are not overly bearish . and worth a trade of 35 % to 40 % long calls again march and june 2025 for good reason . I maintain longs only in MSFT now BUT WILL BUY into this drop in the zone BITCOIN should see a 70k print now as well Best of trades WAVETIMER


$QQQ - Could check back the trendlineNASDAQ:QQQ could see further decline into the $454 - $450 area to check back on the trendline started back in October 2023. It is also the 10% drawdown area from its all-time high. 👀

educated guess for Pivot Points, tomorrowPrice has to get back inside the PP Range, fact. All we need for that to happen is about a .236 fib retracement.
The white lines, on top of the blue fib retracement are where i think S6 and r6 will be tomorrow. an educated guess.
30 years of watching price go from extreme to extreme tells me we are oversold, the rubberband is wound too tight, VAWP and P. P. by tomorrow, this is just my opinion of course.

Perfect 5 wave impulseThe move up was a perfect 5 wave impulse, so it looks like we are in for a 3 wave correction
