GLD breakout emerging...Let's seeI bought a Call Option on #GLD with a $181 strike price and 3/4 expiry.
#GLD has been on an uptrend for obvious reasons- it's a hedge against inflation, which is running rampant.
Price is currently compressing in this bullish pennant pattern and I'm taking a bit of risk-on bet that this trend will continue. I'm taking profits quickly on this one in anticipation of a retracement and consolidation before the weekend. Hoping I can squeeze some profits out in the interim!
Who's entering in some EOD positions? What are you buying? Let me know in the comments!
9840 trade ideas

GOLD - All the way up!-First, let's start with the technical side of this matter, and highlight the fact that there is a cup and handle structure formed upon GOLD.
-Second, let's talk about how Russia is thinking about buying more gold, simple logic, demand-supply!
-Third, Fear! It is high and it is deteriorating the market while appreciating the value of gold.
-Fourth, uncertainty, war is here, it will be here for a while, stocks are uncertain, they fail to rise, so what else to buy other than GOLD.
-Oh yeah, BTC is rising as Russians are blocked or have their assets frozen, of course, BTC will go up guess what all these oligarchs and Russian politicians are using right now. But it is more of a temporary catalyst rather than a long-term. Gold still stands more stable.

GOLD TO 155-150The latest escalation in Ukraine raised doubts over the potential for a diplomatic resolution to the ongoing crisis. THUS the flight to safety in most commodities plays. An environment where real rates are rising and the Fed is tightening policy does provide a negative backdrop for gold .
Once Russia vs Ukraine subsides risk on EQUTIY : (45%)
BUT AT ANY GIVING TIME RUSSIA FULLY INVADE UKRAINE WE MAY SEE A VAST REACTION UPWARDS !
AS PER UBS " Expectations for higher interest rates tend to push yields of assets such as U.S. Treasurys higher, potentially lowering the attractiveness of a non-yielding asset such as gold ."
PLEASE LIKE AND COMMENT AND CRITICIZE THE IDEA !

GOLD, Short- Long termToday I take up puts on gold,
Expiry July 2023, Strike $145
If this is anything like the last time gold topped, which is looking strikingly similar,
The puts should print over time.
Targets
147
142
I'll stop out with a close above 183

GLD Monthly Breakout Imminent!11 month accumulation with a big range expansion in Feb. There is the possibility to expect a second level target here which would bring the price target to around $204. I'll wait till the end of Feb before entering to await confirmation of a breakout.
As long as the price stays above ~173.80 we will have a confirmed breakout.
Closing for the month above $173.80 would make the monthly range expansion greater than the previous candle, confirming the breakout.

Gold breakout This is obviously not good for the broad market. However, it's a promising sign for the ones who still trust in gold and other precious metals.
If you want a nice entry, wait for some consolidation, because the daily RSI is overbought. Buying here could be riskier than usual.
Resistance: 180,35 (61,8% Fib retracements from the highs)
Support: 174,89
Price target: 183,67

$GLD Monthly Cup n HandleWorld for some reason keeps feeling shakier and shakier - added some defense to portfolio by adding $GLD. Took a look at the chart and I'd have to say it looks like we are working on a years long cup and handle, where we just broke through the right flag - let's see if we see a pop higher or it is a fakeout.

$GLD Breaking out!!!!!Strong gap up in GLD today. Usually, it will pull back and fill that over the next couple days/weeks and then run. However, it could be a gap and run in a new "favored asset". Meaning it is a great time to be adding today, tomorrow, and the next week under $180. GLL
This is not a recommendation to buy or sell. It is for informational purposes only.

Gold vs Fossil Fuel comparison chartHere's a Gold vs Fossil Fuel etf comparison 15-minute chart week to date:
Do your own due diligence, your risk is 100% your responsibility. This is for educational and entertainment purposes only. You win some or you learn some. Consider being charitable with some of your profit to help humankind. Good luck and happy trading friends...
*3x lucky 7s of trading*
7pt Trading compass:
Price action, entry/exit
Volume average/direction
Trend, patterns, momentum
Newsworthy current events
Revenue
Earnings
Balance sheet
7 Common mistakes:
+5% portfolio trades, capital risk management
Beware of analyst's motives
Emotions & Opinions
FOMO : bad timing, the market is ruthless, be shrewd
Lack of planning & discipline
Forgetting restraint
Obdurate repetitive errors, no adaptation
7 Important tools:
Trading View app!, Brokerage UI
Accurate indicators & settings
Wide screen monitor/s
Trading log (pencil & graph paper)
Big, organized desk
Reading books, playing chess
Sorted watch-list
Checkout my indicators:
Fibonacci VIP - volume
Fibonacci MA7 - price
pi RSI - trend momentum
TTC - trend channel
AlertiT - notification
tickerTracker - MFI Oscillator
www.tradingview.com

SPDR Gold (USA: GLD) Breaks Triangle on High Investor Interest🌟SPDR Gold Shares Trust (USA: $GLD) holds gold bars and from time to time, issues Baskets in exchange for deposits of gold and distributes gold in connection with redemptions of Baskets. The investment objective of the Trust is for the Shares to reflect the performance of the price of gold bullion, less the Trust expenses. The Sponsor believes that, for many investors, the Shares represent a cost-effective investment in gold.

GLD Might Be Waking UpLooks like Gold might be waking up.
Breakout above long down trend line.
Might be worth a LONG call.

$GLD - gold shining brightGold is finally looking like it can keep moving higher. Risk return is still very good here with a low correlated investment. Love to see it above $200 before summer

$GLD - Heading northGLD heading north. Let's see it above $200. This is purely a technical play since there are plenty of reason to believe this is a temporary rise if the fed does not follow through with what they have planned. Russia - Ukraine tensions must be adding to this as well.

$GLD long signal on the weekly chart With Russia creating tension in east of Europe, the safe heaven of inflation is finally moving higher with hopefully a sustainable move to the upside. My method of analysis is the VCP pattern setups for all my swings. Refer to Mark Minervini for the detaisl of the VCP setup but basically it ensures that no selling pression is near overhead of us. Weekly candles also closes between the 2 and 1.5 dev Bollinger Bands meaning that bullish trend is validated but not too extended like the last time we hit similar levels. Increases in volume is also a good sign.
My targets are 174.96/178/180.44/183
My Stop loss is at 170.54

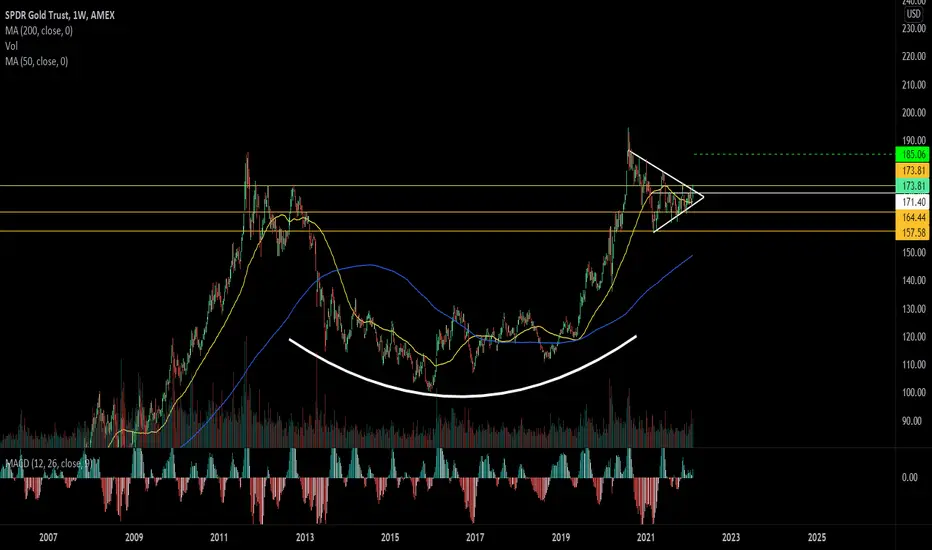
GLD on the weekly here is the weekly view of GLD
really nice long term rounded bottom here with a nice pullback possibly setting up for higher prices
AMEX:GLD
whats everyones thoughts on gold heading into the rest of the year?
charts look pretty bullish to me
HAPPY TRADING
Gold back in style ?Gold had a strong finish to week
showing nice accumulation with solid volume on its way to breaking the 171 mark
if we can break past 178 we could see it test the 185 level
ill be posting a weekly chart on this as well as we are actually right at resistance
either way both the daily and the weekly charts are pointing towards more upside for GLD
thoughts?
HAPPY TRADING

$GLD Broke Out$GLD $GC_F starting to get some love on social media.
Monthly giant cup with handle and a nice looking weekly VCP.
Many traders probably bought this Friday. I didn't. Watching to see if this gives us a lower risk pullback buy or some type of a cheat pivot from here.
GOLD | Trouble in the water?In the following GLD chart we can see a symetrical triangle forming. Due to my thoughts that US:OIL will go down in the following period, energy costs will also dwell.
Lower energy costs + hawkish fed = inflation will be diminished -> gold pullback.
I might be /hella/ wrong.
Only time will decide.


GLD Fib Lvl BreakLevel broke retested and continuing up. should reach the 176 target easily manage when close.

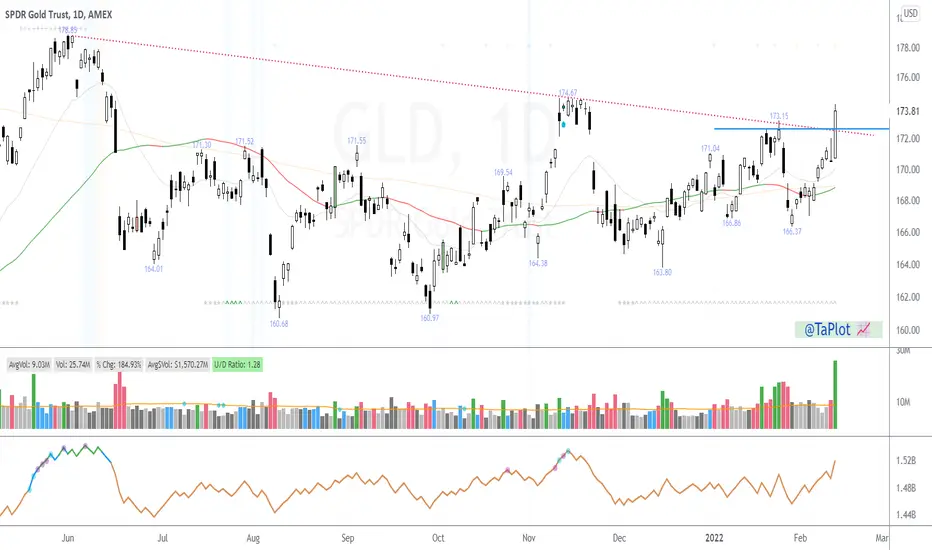
Gold Attempts a BreakoutThe SPDR Gold Trust ETF has squeezed into a tight range since rallying in mid-2020, and now it may be attempting a breakout.
The main pattern on today’s chart is the pair of converging trendlines running along the highs and lows. GLD made a higher high today for the first time in over a year.
Second, notice how the 200-day simple moving (SMA) turned higher in mid-December and has continued to rise since. That’s a potential sign of the longer-term trend growing more bullish.
Third is the overall macro context, with investors increasingly worried about inflation and Ukraine tensions. Crude oil is back to its highest levels since 2014, while other commodities like soybeans and corn are rallying. That backdrop can potentially increase demand for gold – especially because of its added status as a safe-haven asset.
TradeStation is a pioneer in the trading industry, providing access to stocks, options, futures and cryptocurrencies. See our Overview for more.
Important Information
TradingView is not affiliated with TradeStation Securities Inc. or its affiliates. TradeStation Securities, Inc., TradeStation Crypto, Inc., and TradeStation Technologies, Inc. are each wholly owned subsidiaries of TradeStation Group, Inc., all operating, and providing products and services, under the TradeStation brand and trademark. When applying for, or purchasing, accounts, subscriptions, products and services, it is important that you know which company you will be dealing with. Please click here for further important information explaining what this means.
This content is for informational and educational purposes only. This is not a recommendation regarding any investment or investment strategy. Any opinions expressed herein are those of the author and do not represent the views or opinions of TradeStation or any of its affiliates.
Investing involves risks. Past performance, whether actual or indicated by historical tests of strategies, is no guarantee of future performance or success. There is a possibility that you may sustain a loss equal to or greater than your entire investment regardless of which asset class you trade (equities, options, futures, or digital assets); therefore, you should not invest or risk money that you cannot afford to lose. Before trading any asset class, first read the relevant risk disclosure statements on the Important Documents page, found here: www.tradestation.com .

Interesting breakout for GLD on monthly chartInteresting breakout, for now, hasn’t been able to hold the last couple of times. MACD is curling here too.
