9840 trade ideas


Long Opportunity in GLD? (2/2)Here is a scenario that would match the broader assets' bearish case.
The subminuette 2 in blue is incredibly short in time which is quite an issue.
We were expecting a flat within the yellow micro 2 but we are currently consolidating instead of dumping (to start subwave C of the flat).

Long Opportunity in GLD? (1/2)Here is a scenario that would match the broader assets' bearish case.
The subminuette 2 in blue is incredibly short in time which is an issue.
We were expecting a flat within the yellow micro 2 but we are currently consolidating instead of dumping (to start subwave C of the flat).

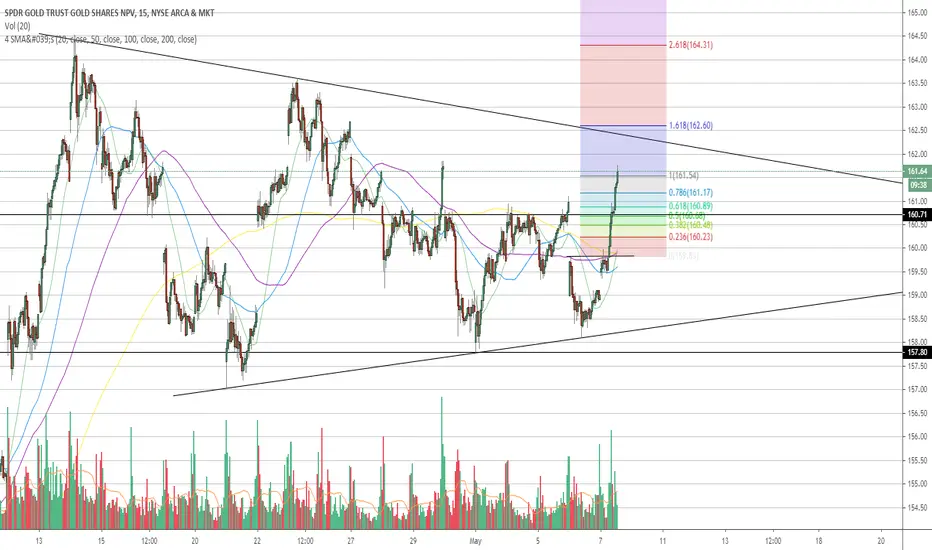
GOLD looking bullish !GOLD ($GLD)
Currently in a bullish trend and displaying consolidating volatility which means a big move in either direction. Expectations of continuing in a bullish trend in a setup resembling something we currently have is usually more probable.
I will be looking to enter the trade at $161.10. Intermediate target at $165.29 and full target at $166.83. Potential to overperform as there is a “key level of significance” at $174 as your next major resistance. Stop Loss set at $158.10. On Balance Volume also looks strong for the bullish scenario on this chart as well as for $XAU/USD while doing a 360-degree analysis.

Gold to Test ATH Soon?With the unemployment rate being announced later this week I have been keeping an eye on the gold markets for clues on a direction. Expectations are that unemployment will increase substantially from the last reported 4.4% to levels that haven't been seen since the 1930's. However, the price of gold hasn't really "outperformed" during the Covid-19 pandemic when compared next to other asset classes which begs the question, will the unemployment numbers really matter?
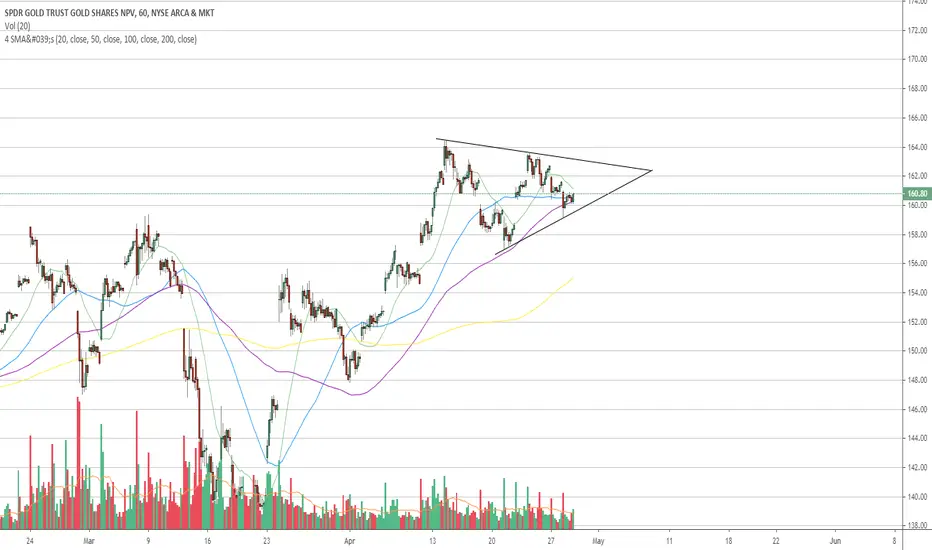
Looking at the charts gold has been in consolidation since breaking out of the inverse head and shoulders on April 6th. Price has retested and been trading flat since April 14th. The chart below is of the SPDR Gold Trust ETF (GLD). Current support is 156.95 and is a must hold if more upside is to follow.
On the 4-hour chart above, I've highlighted how volume increased on the break of the inverse head and shoulders, and as price returned to retest support volume has settled nicely. MACD confirms this and is beginning to show potential strength in bullish momentum. If GLD breakout, targets should be set towards 174, which conveniently is nearly all-time high resistance.
How confident can we be on this trade? Below is the weekly chart of GDX, a Gold Miners ETF. Here, note the weekly retest of previous resistance at 31. How strong the support remains to be seen, but the strength on the gold miners is undeniable and reaffirms the gold trade to the upside.
Heading into the potentially historic unemployment announcement this Friday, it may be a safe bet to look into gold if you believe in the safe haven narrative. If you are a trader like me, GLD and GDX present opportunities to make 10-20% returns in a short period. Bias: Bullish .

GLD -> 163?On the heels of the SPY seeing some uncertain days, I predict that the price on GLD will follow the monthly trend and float up to the 160s, and potentially even higher if the market dumps.

SGX GLD US$ Longgld etf is in uptrend and currently trading near the mid-point of long term channel and lower bound of short-term channel. potential long trade entry @ 159.68 with stop-loss @ 157.84 and profit taking @ 165.96


GLD/SLV - ready to fall?Finally a MACD cross on the 3 day chart. Extreme spike pattern looks similar to 2008. SLV has still only retraced about 50% of the losses sustained in March. I keep waiting for catch-up and it looks like it's coming. This ratio should be under 10 soon and SLV should be on its way to pre-selloff price action.


GLD - a long downward trend aheadGLD seems to have reached the end of minor wave 2 up. Minor wave 3 should last many months and should take prices to levels much lower than 136. As shown by the Commitment of Traders graph, speculators continue to be at record net-long positions in gold futures and at this junctures they are usually wrong as shown in history. FOLLOW SKYLINEPRO TO RECEIVE UPDATES.

Gold ETF GLD under way to a up to a 40% correction On March 2nd Gold reached the end of a primary upward corrective wave and began its path down in primary wave C. The correction should last around 2 and 3 years and can reach up to 40% decrease in its price.

Another big drop for GOLD aheadGLD finished wave 2 up. The next moves should be down with a total decline of more than 20% duribng the next few days. FOLLOW SKYLINEPRO TO GET UPTDATES.


Gold vs. SP500$GLD vs. $SPY weekly chart foing back to 2005. showing favorable strength vs. SPY of late

Potential H&S on GoldIndicators beginning to confirm it. Not in overbough territory so the upside looks good too. Will need volume pick to confirm it.
Stop: just below neckline
I've been looking to enter a longer term position on gold anyways

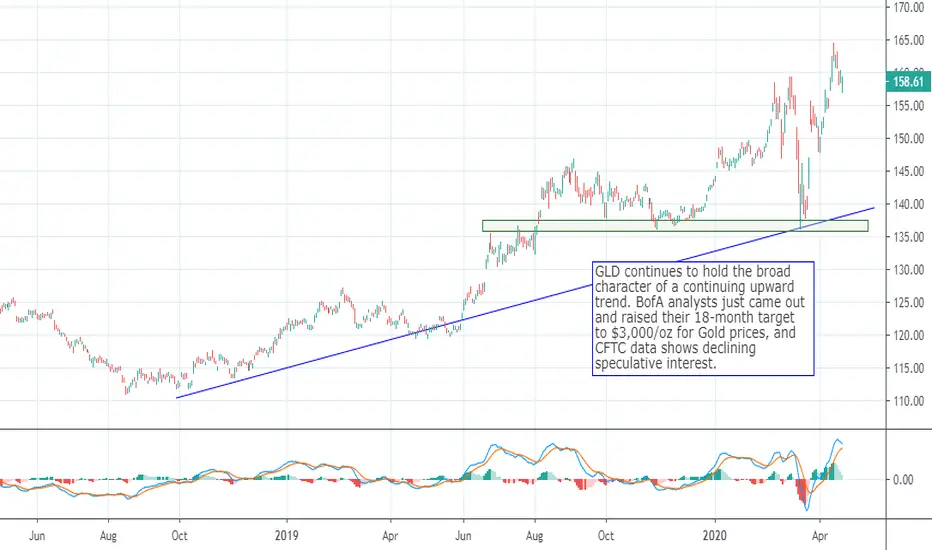
$GLD Holds Trending Posture on Declining Spec InterestGLD continues to hold the broad character of a continuing upward trend. BofA analysts just came out and raised their 18-month target to $3,000/oz for Gold prices, and CFTC data shows declining speculative interest.

Gold is going down ... at least in the short term.I see a Head and Shoulders pattern forming with the head just peaking a few days go. We should see gold move down in the next day or two.
I have 2 options for the right shoulder.
I use the DMI, MacD and Stoch RSI to point me in the which direction.
I also use Fisher indicator and Commodity Channel Index for entry point. (not shown)
I use the CCI as opposed to the RSI because I can get more buy signals with it.
